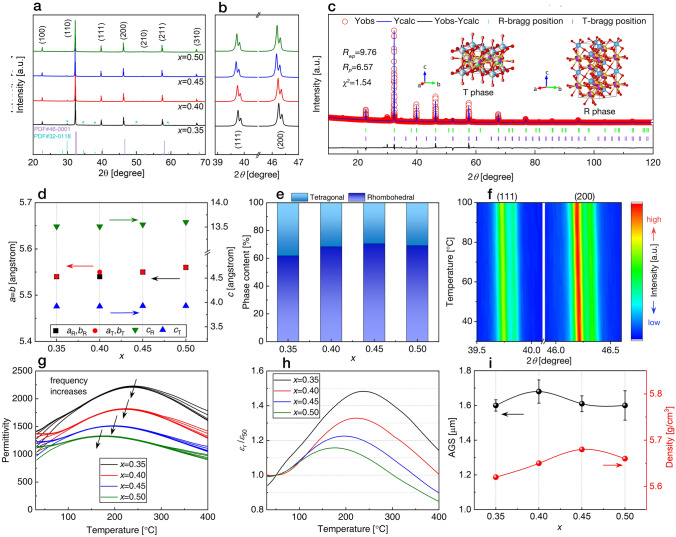
Fig. 2.
a XRD pattern of ceramics with varying x (0.35, 0.40, 0.45, and 0.50) in the 20°–70° range. b Enlarged views of the diffraction peaks at 39°–40.5° and 45.5°–47°. c Fitted XRD pattern for x = 0.50 ceramic powders. d Variation of lattice parameters with x for B-xSB ceramics. e Proportion variation of the R and T phases for different compositions. f Temperature evolution of XRD patterns for x = 0.50 ceramic from 30 to 100 °C at selected angles of 39.5°–40° and 46°–46.5°. g Temperature-dependent εr and tanδ for x = 0.35, 0.40, 0.45, and 0.50 at measurement frequencies of 0.3, 1, 10, 100, and 1000 kHz, ranging from 30 to 400 °C. The long arrow indicates the direction of increasing measurement frequency. h εr/ε50 as a function of temperature measured at 1 kHz, where ε50 was measured at 50 °C, and εr was measured from 30 to 400 °C. i AGS and density variations with x for B-xSB ceramics

