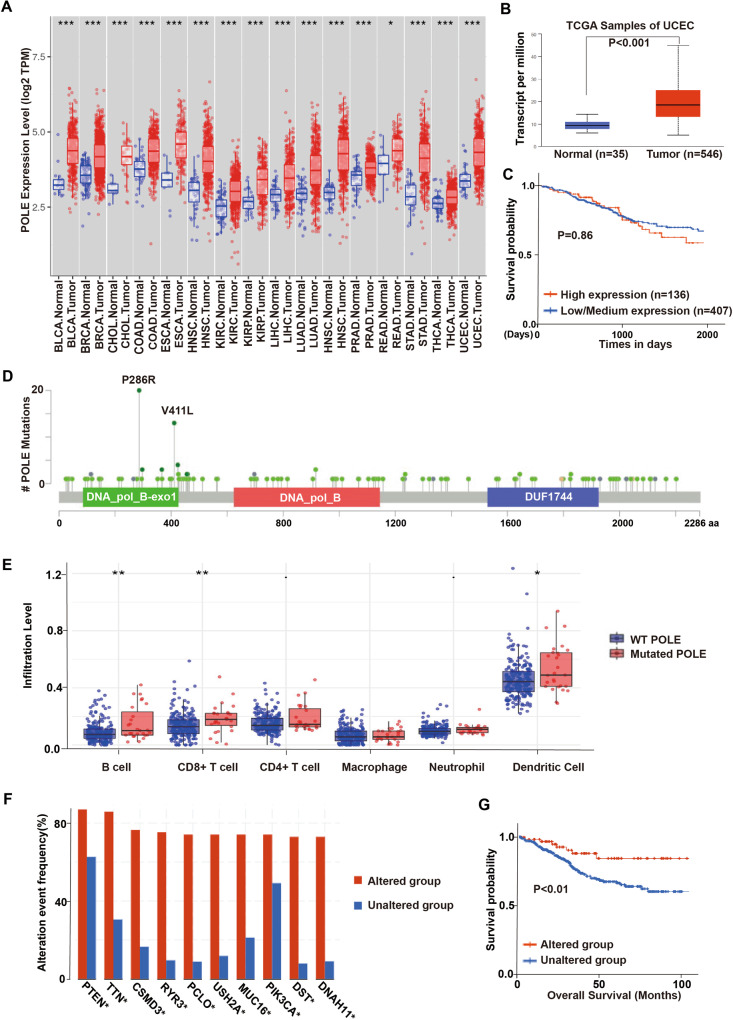
Fig. 1. POLE mutations elicit immune activation in endometrial cancer.
A The expression levels of POLE in cancers and their adjacent normal tissues from the TCGA database of TIMER website (BLCA bladder urothelial carcinoma, BRCA breast invasive carcinoma, CHOL cholangiocarcinoma, COAD colon adenocarcinoma, ESCA esophageal, HNSC head and neck squamous cell carcinoma, KIRC kidney renal clear cell carcinoma, KIRP kidney renal papillary cell carcinoma, LIHC liver hepatocellular carcinoma, LUAD lung adenocarcinoma, HNSC Head and Neck squamous cell carcinoma, PRAD prostate adenocarcinoma, READ rectum adenocarcinoma, STAD stomach adenocarcinoma, THCA thyroid carcinoma, UCEC uterine corpus endometrial carcinoma). B The mRNA level of POLE in normal tissues and ECs from the TCGA database. C Kaplan–Meier survival curves of endometrial cancer patients with high or low POLE expression level. Both high and low POLE groups were defined by the median expression value of the POLE transcript among the study population. The EC patients whose POLE level exceeded the median value were termed high expression, whereas the other patients with low POLE expression levels were named low expression. D Schematics of the POLE proteins show the positions of individual somatic mutations identified in the endometrial cancer TCGA cohort. E The correlation between POLE mutations and the infiltration abundance of immune cells (B cell, CD4+ T cell, CD8+ T cell, macrophage, neutrophil, and dendritic cell) in endometrial cancer. F The comparison of immune infiltration level among tumors with somatic copy number alterations by the SCNA module. G Kaplan–Meier survival curves of EC patients with POLE mutations or WT POLE. Data are shown as mean ± SD. *p < 0.05, **p < 0.005, ***p < 0.001 significantly different from Control.

