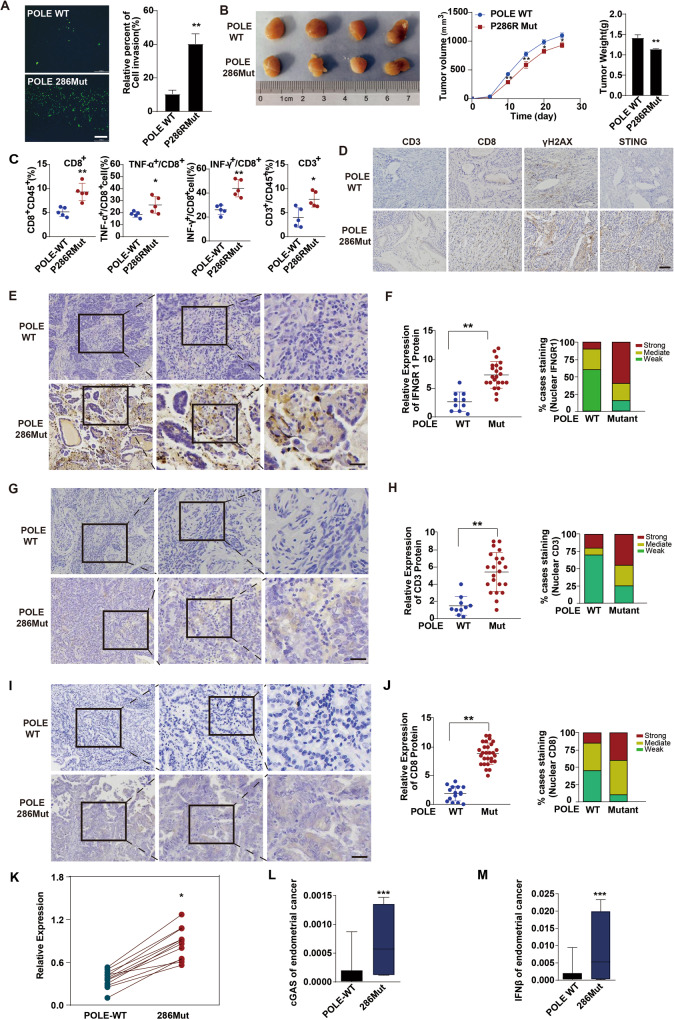
Fig. 6. POLE P286R mutation enhances immune cell infiltration and activates the cGAS-STING pathway in human endometrial carcinomas.
A Representative images of transwell migration assay of T cells cocultured with WT EC cells or mutant POLE cells. B Tumorigenicity assessment of human EC cells with POLE P286R mutation or WT POLE in the humanized huHSC-NCG mice. Left: representative tumor pictures; Middle: tumor growth curves; Right: tumor weights. C Flow cytometry analysis of the percent of parent immune cells in the above tumors with POLE P286R mutation or WT POLE. D Representative images of IHC staining of CD3, CD8, γH2AX, and STING proteins in above tumors with POLE P286R mutation or WT POLE. Scale bar, 50 μm. E Immunohistochemical analysis of IFNGR1 expression in human EC specimens. The images are sequentially magnified from left to right, and the black frames indicate the amplification area. Scale bar, 100 μm. F Quantification of IFNGR1 expression intensity in (E). G Immunohistochemical staining of CD3 expression in human EC specimens. The pictures are sequentially magnified from left to right, and the black frames suggest the amplification area. Scale bar, 100 μm. H Quantification of CD3 staining intensity in (G). I Immunohistochemical analysis of CD8 expression in human EC specimens. The images are sequentially magnified from left to right, and the black frames indicate the amplification area. Scale bar, 100 μm. J Quantification of the intensity of CD8 staining in (I). K Quantification of STING expression level in human EC specimens with POLE P286R mutation or WT POLE. L Quantification of cGAS level in human EC specimens with WT or mutant POLE. M Quantification of IFNβ expression level in human EC specimens with WT or mutant POLE. Data are shown as mean ± SD. *p < 0.05, **p < 0.005, ***p < 0.001 significantly different from Control.

