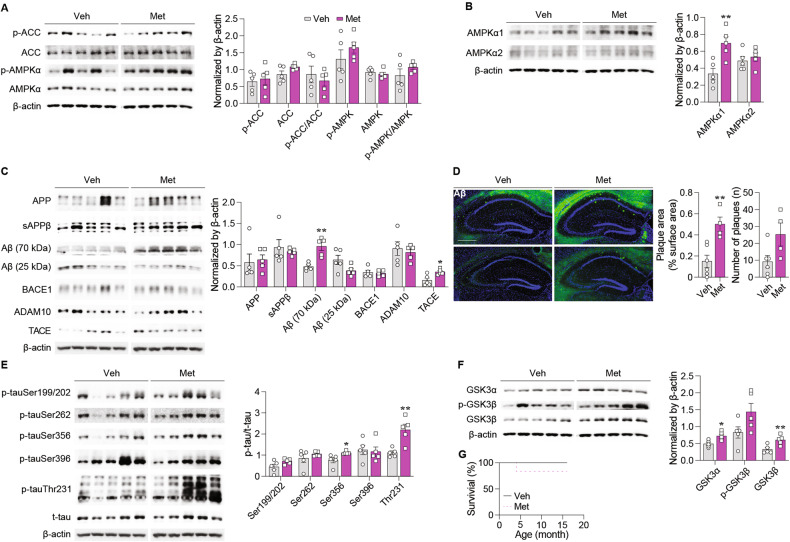
Fig. 4. Long-term metformin treatment upregulated AMPKα1 expression and aggravated AD pathology in AD mice.
Western blot analysis band images and quantification of (A) ACC and AMPKα expression and their phosphorylation levels (p-ACC, p = 0.709; ACC, p = 0.589; p-ACC/ACC, p = 0.525; p-AMPKα, p = 0.318; AMPKα, p = 0.535; p-AMPKα/AMPKα, p = 0.280), (B) AMPKα1- and α2-subunit expression (AMPKα1, p = 0.008; AMPKα2, p = 0.550), and (C) APP, sAPPβ, Aβ, ADAM10, TACE, and BACE1 expression [APP, p = 0.781; sAPPβ, p = 0.622; Aβ (70 kDa), p = 0.002; Aβ (25 kDa), p = 0.074; ADAM10, p = 0.626; TACE, p = 0.014; BACE1, p = 0.742; t test] in the hippocampus of 17-month-old AD mice (Veh: n = 5, Met: n = 5). D Representative immunohistochemistry images of D56D2-positive Aβ deposition and quantification of the percentage of Aβ plaque-positive area and the number of Aβ plaques in the hippocampus of 17-month-old AD mice (Veh: n = 6, Met: n = 4; area, p = 0.005; number; p = 0.052; t test). Scale bar: 500 μm. Western blot analysis band images and quantification of (E) p-tau and t-tau expression (F) GSK3α, GSK3β, and phosphorylated GSK3β expression (GSK3α, p = 0.015; p-GSK3β, p = 0.081; GSK3β, p = 0.009; t test) in the hippocampus of 17-month-old AD mice (Veh: n = 5, Met: n = 5). G The survival rate of AD mice (Veh: n = 6, Met: n = 6; p = 0.317; log-rank test) during metformin treatment. Data are presented as mean ± SEM. *p < 0.05, **p < 0.01 versus Veh. Veh, Vehicle, Met Metformin.

