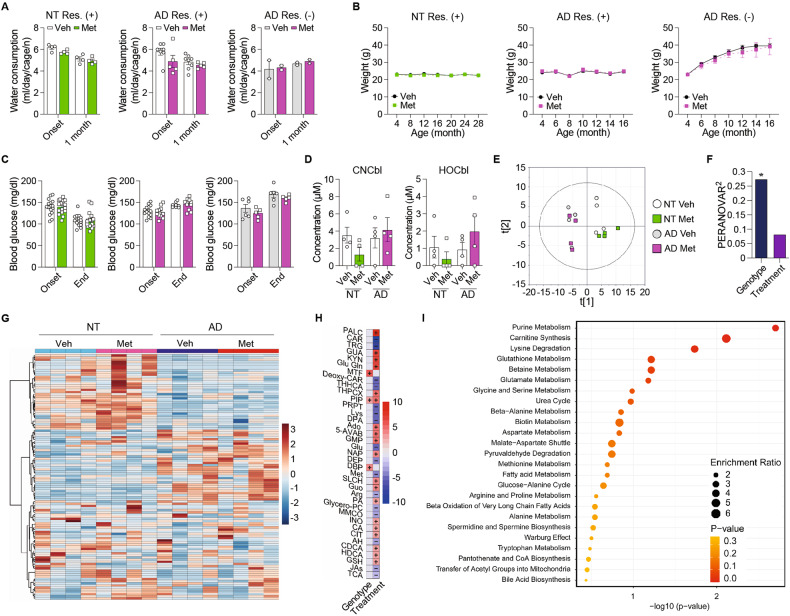
Fig. 5. Long-term metformin treatment caused no adverse outcomes in NT and AD mice.
A Water consumption of NT mice with food restriction (Veh: n = 4, Met: n = 4; p = 0.170; RM-ANOVA), AD mice with food restriction (Veh: n = 8, Met: n = 5; p = 0.160; mixed effects model), and AD mice without food restriction (Veh: n = 2, Met: n = 2; p = 0.696; RM-ANOVA). B Weight of NT mice with food restriction (Veh: n = 16, Met: n = 16; p = 0.634; mixed effects model), AD mice with food restriction (Veh: n = 14, Met: n = 12; p = 0.792; mixed effects model), and AD mice without food restriction (Veh: n = 6, Met: n = 5; p = 0.589; RM-ANOVA). C Fasting blood glucose concentration of NT mice with food restriction (Veh: n = 16, MET: n = 16; p = 0.996; mixed effects model), AD mice with food restriction (Veh: n = 14, Met: n = 12; p = 0.849; mixed effects model), and AD mice without food restriction (Veh: n = 6, Met: n = 5; p = 0.178; RM-ANOVA). D CNCbl and HOCbl concentration in the serum of NT and AD mice (n = 4 per group; CNCbl, NT mice, p = 0.113; AD mice, p = 0.615; HOCbl, NT mice, p = 0.397; AD mice, p = 0.321; t test). E Score scatter plot showing the distribution of vehicle- and metformin-treated NT and AD mice based on principal component analysis. F Permutational multivariate analysis of variance showing changes in serum metabolites of vehicle- and metformin-treated NT and AD mice clustered by group and genotype (genotype, r2 = 0.272, p < 0.001; treatment, r2 = 0.08, p = 0.204). G Heatmap of hierarchical clustering analysis showing chemically and biochemically classified metabolites of serum from vehicle- and metformin-treated NT and AD mice clustered by group and genotype. H Multiple linear regression analysis showing changes in serum metabolites of vehicle- and metformin-treated NT and AD mice. Full names of metabolites were shown in Table S2. I Metabolite set enrichment analysis showing changes in serum metabolites of vehicle- and metformin-treated groups of NT mice. Data are presented as mean ± SEM. *p < 0.05, **p < 0.01 versus Veh. Veh, vehicle; Met metformin, NT non-transgenic C57BL/6 mice, AD 3xTg-AD mice, Res food restriction, CNCbl cyanocobalamin, HOCbl, hydroxocobalamin.

