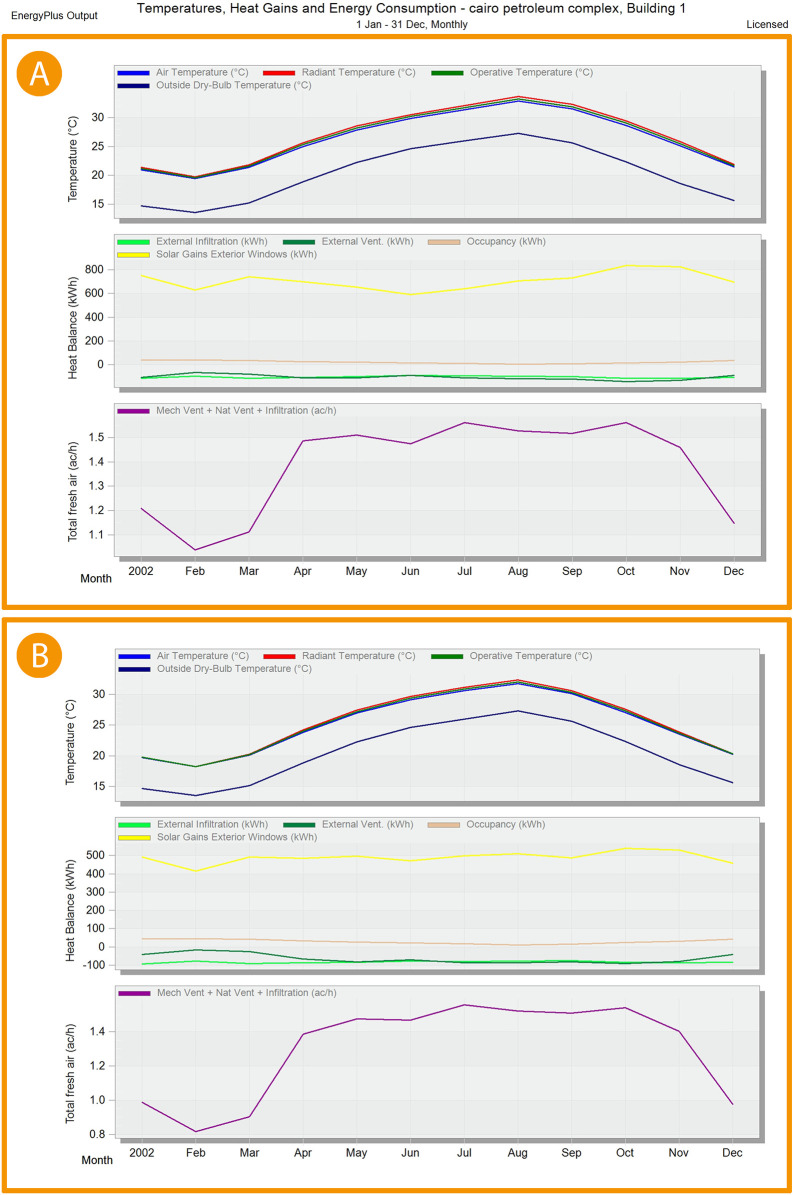
Figure 22. EnergyPlus monthly simulation results for Temperatures, heat gains and energy consumption of the selected office from 1 Jan- 31 Dec (A) Base case, (B) Post-criteria implementation.
Showing increased natural ventilation and decreased solar glare and thermal gain. The photos (A) and (B) were acquired from the researcher’s work on the case study office building using the computer software “DesignBuilder” to simulate the changes in the space.

