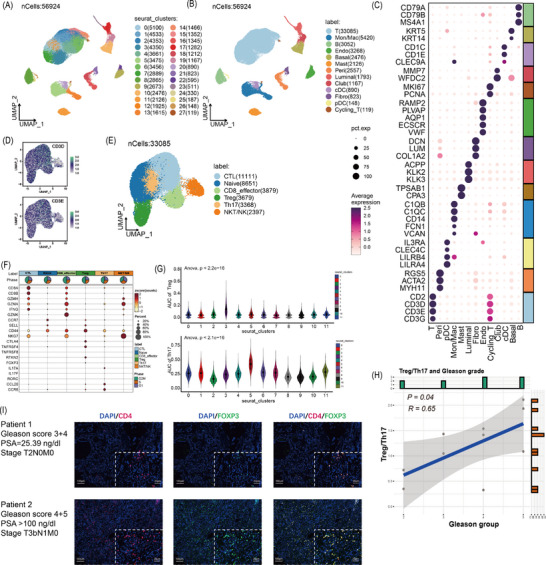
FIGURE 1.

Single‐cell analysis. (A) Uniform manifold approximation and projection (UMAP) visualization of 28 clusters. (B) UMAP visualization of 13 cell types, including 33085 T cells, 3052 B cells, 3268 endothelial cells, 2476 basal epithelial cells, 1793 luminal epithelial cells, 1167 club epithelial cells, 2126 mast cells, 2557 pericytes, 890 cDC cells, 148 pDC cells, 823 fibroblasts, 5420 macrophages/monocytes and 119 cycling T cell. (C) Dot plot showing the expression level of marker genes, including T cells (CD2, CD3D and CD3E), B cells (CD79A, CD79B and MS4A1), endothelial cells (RAMP2, PLVAP, AQP1, ECSCR and VWF), basal epithelial cells (KRT5 and KRT14), luminal epithelial cells (ACPP, KLK2 and KLK3), club epithelial cells (MMP7 and WFDC2), mast cells (TPSAB1 and CPA3), pericytes (RGS5, ACTA2 and MYH11), cDC cells (CD1C, CD1E and CLEC9A), pDC cells (IL3RA, CLEC4C, LILRB4 and LILRA4), fibroblasts (VWF, DCN, LUM), macrophages/monocytes (C1QB, C1QC, CD14, FCN1 and VCAN) and cycling T cells (CD2, CD3D, CD3E, MKI67 and PCNA). (D) A total of 33,085 T cells were further extracted and performed batch effect elimination, dimensionality reduction and clustering and the UMAP plot showed the expression of specific T cell markers of CD3D and CD3E. (E) The UMAP showed six types of T cells (11111 CTL, 3879 CD8+ T effector, 2397 NKT cells, 8651 CD4+ naïve T, 3679 CD4+ regulatory T [Treg] and 3368 Th17 cells). (F) Dot plot showing the expression of specific T cell markers among these six type T cells, including CTL (CD8A, CD8B, GZMH and GZMA), CD8+ T effector cells (CD8A, CD8B, IFNG and GZMK), NKT cells (NKG7 and CD44), CD4+ naïve T cells (CCR7 and SELL), CD4+ Treg cell (CTLA4, TNFRSF4, TNFRSF8, RTKN2 and FOXP3) and Th17 cells (IL17A, IL17F, RORC, CCL20 and CCR6). (G) Comparison of the AUCell score of Treg activity between the C3 cluster and the other 10 clusters (upper); Comparison of the AUCell score of Th17 activity between the C5 cluster and the other 10 clusters (lower). (H) The correlation between Gleason groups and Treg/Th17 ratios. (I) Multiplex immunofluorescence showed the location and co‐location of CD4 and FOXP3 in prostate cancer (PCa) tissues.
