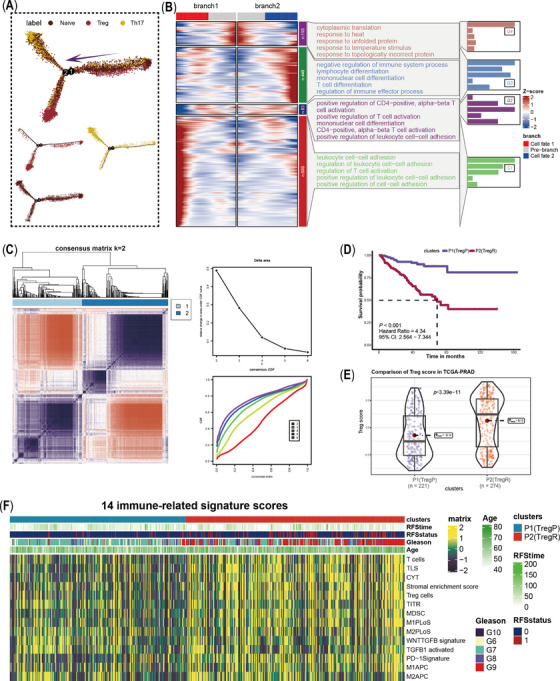
FIGURE 2.

Pseudotime analysis of CD4+T cells and construction of regulatory T (Treg)‐prostate cancer (PCa) classification. (A) Differentiation trajectories of CD4+Treg, Th17 and CD4+Naïve cells. (B) Branch point analysis based on pseudotime trajectory and GO enrichment analysis. Genes of C1 expressed increase significantly as cells differentiate towards branch1 (Th17), and enriched into positive regulation of immune pathways; less difference of C2 genes was observed in the two cell fates, which were more likely related to positive regulation of T cell activation, mononuclear cell differentiation and positive regulation of leukocyte cell‐cell adhesion; genes of C3 increases as cells differentiate towards branch 2 (Treg), and were enriched into negative of immune system process; C4 genes highly expressed at the initiation of two cell fates, which were enriched to cytoplasmic translation, response to heat, response to unfolding protein, response to temperature stimulus and response to topologically incorrect protein. (C) Construction of a binary classification system for PCa based on unsupervised clustering algorithms and 75 branch‐dependent genes. (D) K‐M plot showed poor‐Treg PCa (TregP) had a higher survival probability than rich‐Treg PCa (TregR). (E) Comparison of Treg score between TregP and TregR. (F) Distribution of 14 immune‐relevant signatures among TregP and TregR.
