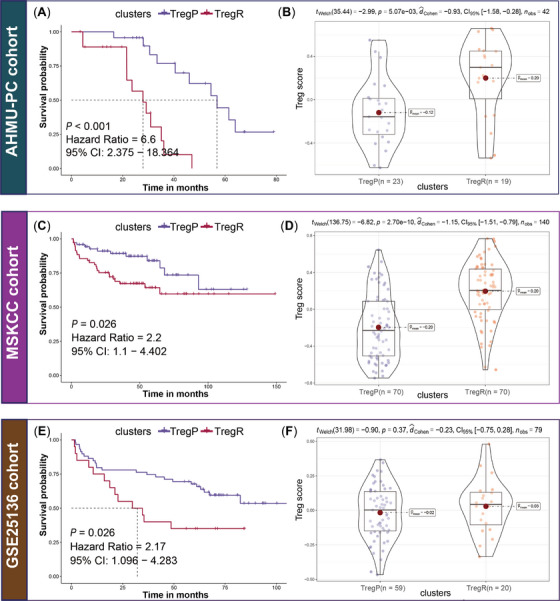
FIGURE 3.

Validation in three external cohorts. (A) K‐M analysis in AHMU‐PC cohort. Rich‐Treg PCa (TregR) presented shorter recurrence‐free survival (RFS, p < .001, hazards ratio [HR] = 6.6, 95%CI: 2.375–18.364) than poor‐Treg PCa (TregP); (B) Comparison of the Treg activity between TregP and TregR in AHMU‐PC cohort, TregR presented higher Treg score (p = 5.07e‐03) than TregP; (C) K‐M analysis in MSKCC cohort. Compared to TregP, TregR presented a shorter RFS (p = .026, HR = 0.45, 95%CI: 0.227–0.909); (D) Comparison of the Treg activity between TregP and TregR in MSKCC cohort, and TregR presented higher Treg score (p = 2.70e‐10) than TregP; (E) K‐M analysis in GSE25136 cohort. TregR had poorer clinical outcome than TregP (p = .026, HR = 2.17, 95%CI: 0.096–4.283); (F) Comparison of the Treg activity between TregP and TregR in the GSE25136 cohort, higher Treg score was observed in TregR despite no statistical significance (p = .37), which might be related to the small sample size.
