FIGURE 4.

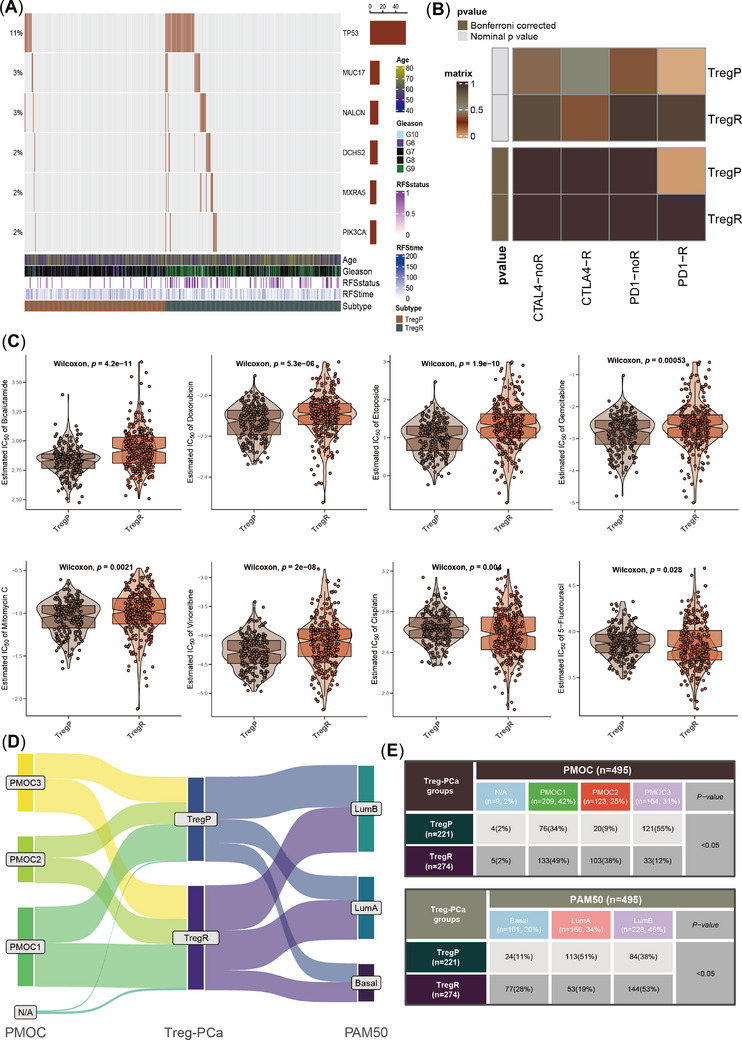
Comparison of gene mutation patterns, sensitivity to immunotherapy and chemotherapy and published molecular classifications. (A) The top six most differently mutated genes between rich‐Treg PCa (TregR) and poor‐Treg PCa (TregP), including TP53, MUC17, NALCN, DCHS2, DCHS2, MXRA5 and PIK3CA. (B) SubMap analysis for deciphering the different responses to anti‐PD‐1 or CTLA‐4 therapy. (C) Comparison of the sensitivity to eight chemotherapeutic drugs, including bicalutamide, doxorubicin, etoposide, gemcitabine, mitomycin C, vinorelbine, cisplatin, 5‐fluorouracil and the lower IC50, the higher the sensitivity. (D) Sankey plot showed the distributions of TregP and TregR in PMOC classification (left) and PAM50 classification (right). (E) χ2 test table showed the concrete proportions of TregP and TregR subtypes in different molecular classifications.
