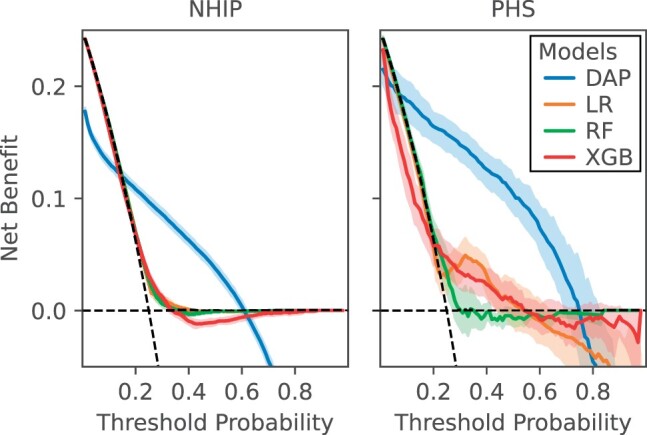
Figure 4.

Comparison of decision curve analysis between depression and anxiety prediction (DAP) model and baseline models (logistic regression [LR], random forest [RF], extreme gradient boosting [XGB]) for depression or anxiety risk prediction in 365 days for cohorts from Nanjing Health Information Platform (NHIP) and primary healthcare services (PHS). The net benefit of the decision curve analysis (DCA) curve is calculated based on the 10-fold internal validation.
