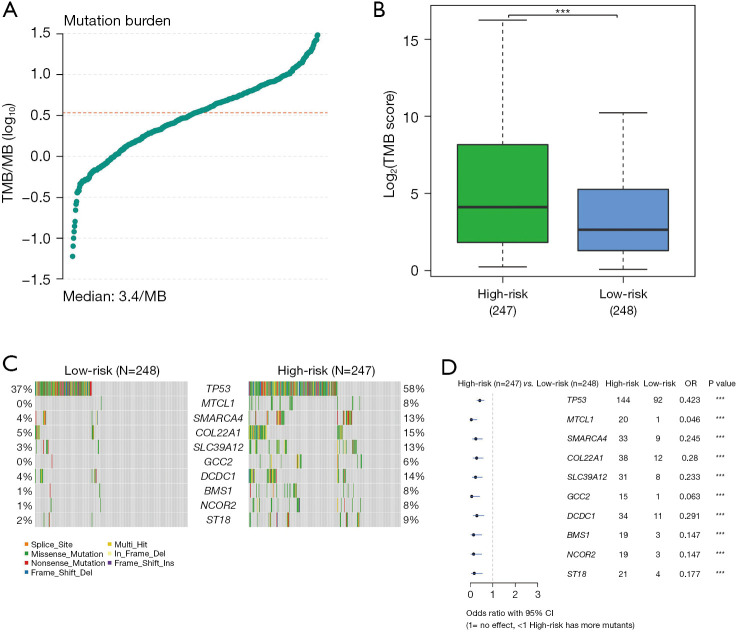
Figure 12.
Analysis of TMB in LUAD. (A) TMB score. (B) Relationship diagram showing the association between TMB and risk counts. (C) Distribution map of the 10 genes showing the greatest variation between groups. (D) Forest plot displaying the variation difference results of the top 10 genes. ***, P<0.01. TMB, tumor mutational burden; MB, megabase; OR, odds ratio; CI, confidence interval; LUAD, lung adenocarcinoma.

