Figure 13.

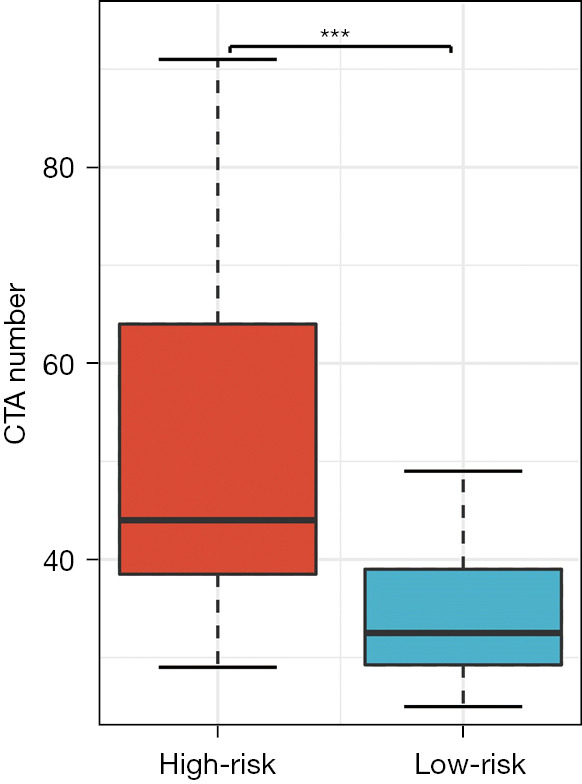
Box plot illustrating the differences in CTA gene numbers between the low-risk and high-risk groups. ***, P<0.01. CTA, cancer-testicular antigen.

Box plot illustrating the differences in CTA gene numbers between the low-risk and high-risk groups. ***, P<0.01. CTA, cancer-testicular antigen.