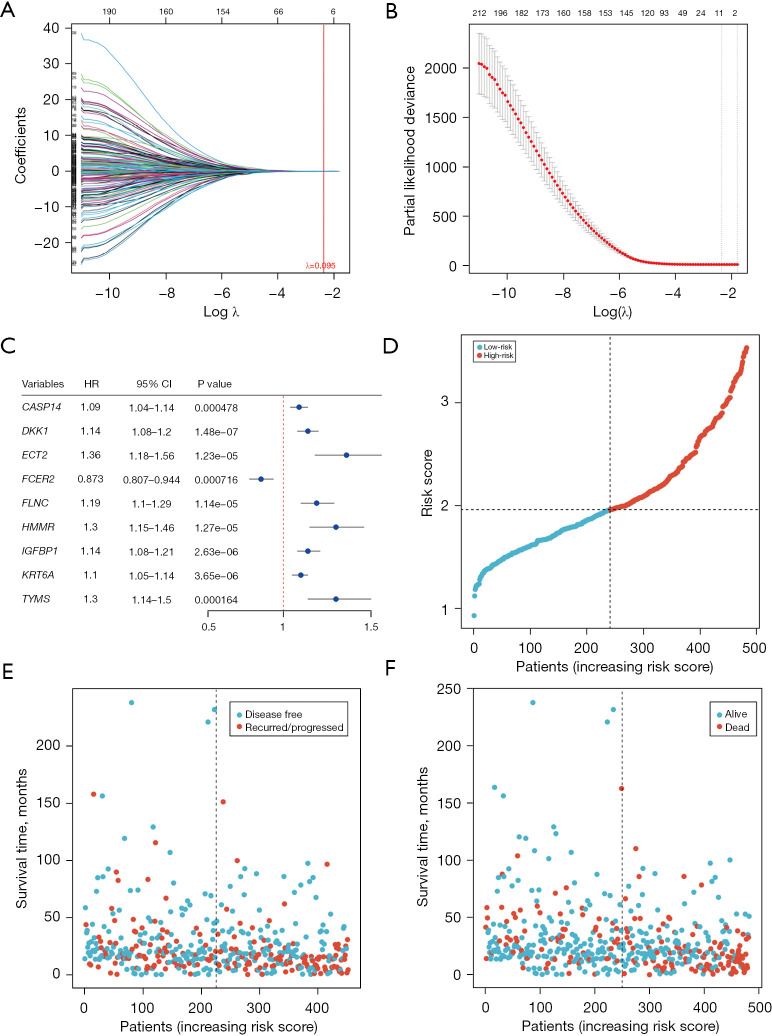
Figure 7.
Construction of the LASSO regression model. (A,B) Graphs depicting the results of LASSO regression and cross-validation. (C) Results of one-way Cox regression analysis of marker genes (genes with nonzero LASSO regression coefficients). (D) Plot showing the sorting of risk values. (E,F) Graphs illustrating the relationship between risk values and survival status. HR, hazard ratio; CI, confidence interval; LASSO, least absolute shrinkage and selection operator.

