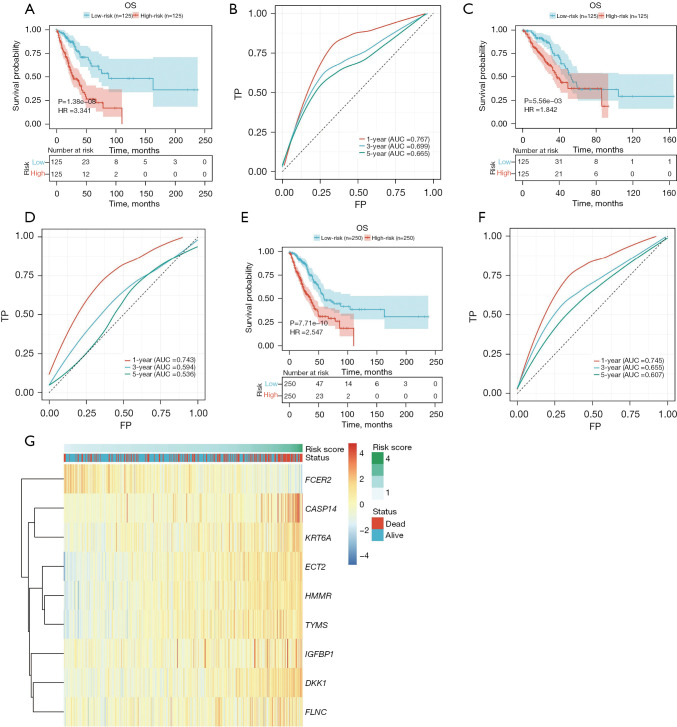
Figure 8.
Internal validation of a prognostic model for predicting the prognosis of LUAD. (A) KM survival analysis showing that the high-risk subtypes in the training group had poorer OS. (B) Time-dependent ROC curves demonstrating the predictive performance of the model in the training group, with AUCs of 0.767, 0.699, and 0.665 for 1, 3, and 5 years, respectively. (C) OS analysis in the test group indicating that patients classified as high-risk subtypes had worse survival outcomes. (D) Time-dependent ROC curves in the test group, displaying AUCs of 0.743, 0.594, and 0.536 for 1, 3, and 5 years, respectively. (E) OS analysis in the total sample group revealing that patients classified as high-risk subtypes had inferior survival. (F) Time-dependent ROC curves in the total sample group, with AUCs of 0.745, 0.655, and 0.607 for 1, 3, and 5 years, respectively. (G) Clustering heat map of marker genes. OS, overall survival; HR, hazard ratio; TP, true positive; FP, false positive; AUC, area under the curve; LUAD, lung adenocarcinoma; KM, Kaplan-Meier; ROC, receiver operating characteristic.

