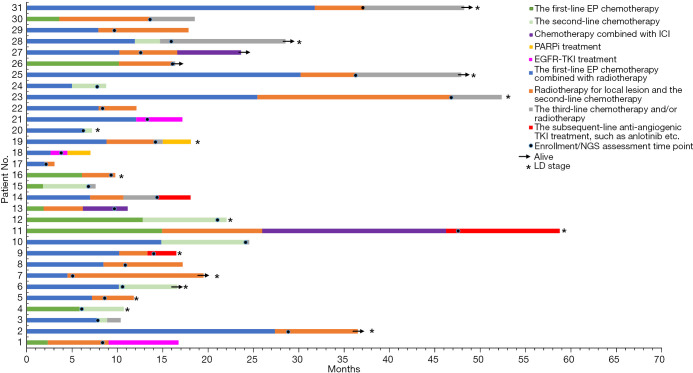
Figure 3.
The swim-plot of survival among 31 patients with relapsed SCLC. Each bar from bottom to top corresponds to No. 1–31 patient in turn, which also corresponds to each column from left to right in Figure 1. The horizontal axis corresponds to 0–70 months. The length of each bar corresponds to the PFS duration of the first-line/second-line/subsequent-line treatment. The black dot on each bar represents the respective time point of NGS sequencing/enrollment. Patients with LD stage are asterisked at the end of the corresponding bar, and the remaining bars non-asterisked correspond to patients with ED stage. In detail, there were 15 patients of LD and 16 patients of ED. All patients received EP chemotherapy alone or combined with radiotherapy as the first-line treatment. The number of prior lines of treatments ranged from 1 to 3 at enrollment. As of 30 September 2020, a total of 23 deaths were recorded. EP, platinum plus etoposide; ICI, immune checkpoint inhibitors; PARPi, poly-ADP-ribose polymerase inhibitor; EGFR, epidermal growth factor receptor; TKI, tyrosine kinase inhibitor; NGS, next-generation sequencing; LD, limited disease; SCLC, small cell lung cancer; PFS, progression-free survival; ED, extensive disease.

