Figure 3.

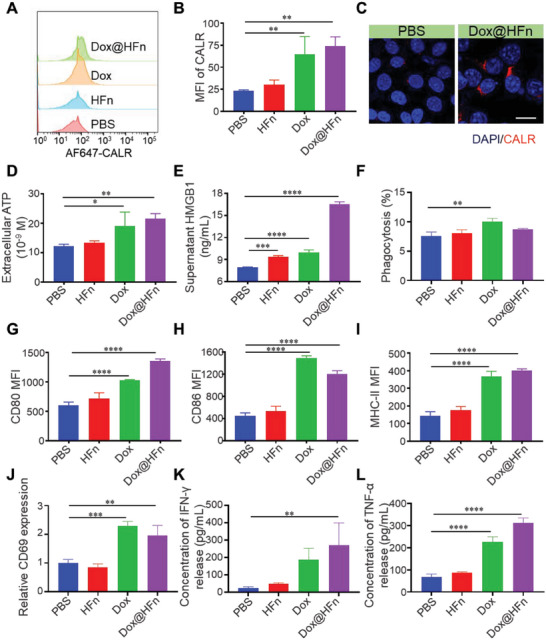
Dox@HFn induced ICD of 4T1 tumor cells in vitro. A) Flow cytometric examination of CALR expression on 4T1 cell surface after incubation with PBS, HFn, Dox, and Dox@HFn for 24 h. B) MFI of 4T1 cells after the treatments (n = 3). C) CLSM images of CALR expression (red) on 4T1 cells after various treatments for 24 h. Scale bars: 20 µm. D) ATP and E) HMGB1 secretion in culture media of 4T1 cells after various treatments for 24 h (n = 3). F) The phagocytosis of BMDCs to 4T1 cells after various treatments (n = 3). BMDCs were co‐cultured with 4T1 cells for 24 h. G–I) The CD80, CD86, and MHC‐II expressions of BMDCs co‐cultured with 4T1 cells after various treatments (n = 3). J) Relative CD69 expression on CD8+ T cells treated with BMDCs for 24 h after different treatments. K) IFN‐γ and L) TNF‐α release from T cells induced by BMDCs after different treatments. Statistical data are presented as means ± SD. *P < 0.05, **P < 0.01, ***P < 0.001, ****P < 0.0001.
