Figure 6.

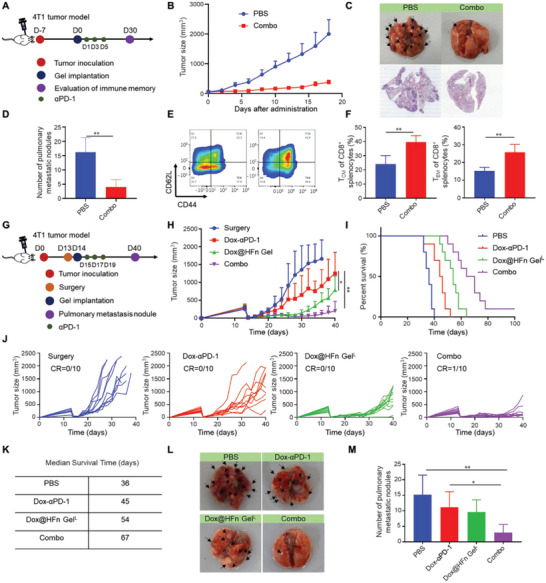
Long‐term immune response of combination therapy in orthotopic 4T1 tumor model. A) Schematic illustration of memory study. B) Tumor growth curve for combination therapy in 4T1 breast tumor model (n = 6). C) Representative photographs and HE staining of the lungs at the end of treatment. D) Quantitative analysis of metastatic nodules on the lungs (n = 5). E) Representative flow cytometry chart and F) percentage of central memory T cells (TCM) and effective memory T cells (TEM) in splenocytes after treatment (n = 4). G) Treatment schedule in 4T1 postsurgical tumor model. H) Tumor growth curves of the mice after surgical resection and various treatments (n = 10). I) Percent survival of mice after various treatments (n = 10). J) Individual tumor growth kineties after various treatments (n = 10). K) Summary of survival time of mice after various treatments. L) Representative photographs and M) quantitative analysis of metastatic nodules on the lungs (n = 10). Statistical data are presented as means ± SD. *P < 0.05, **P < 0.01.
