Figure 3.

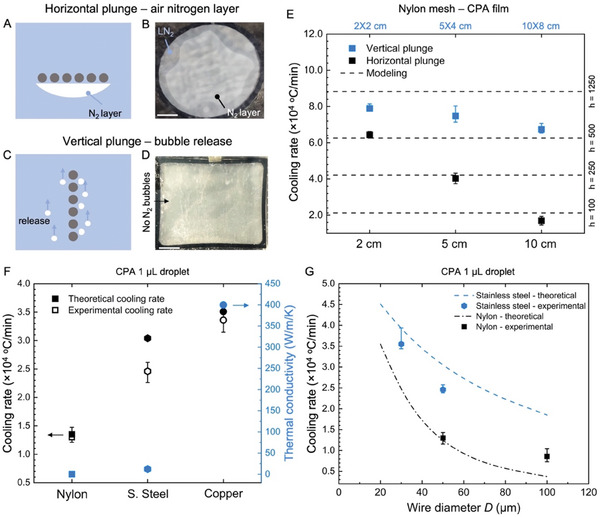
Experimental validation of cooling rate varying as a function of mesh design and plunging. A) Schematic and B) camera image of horizontal LN2 plunge with trapped bubbles. C) Schematic and D)camera image of vertical LN2 plunge with release of vapor layer. E) Measured cooling rates for vertical and horizontal plunge varying with mesh sizes and material at the geometric center of the mesh. The model suggests a lower effective heat transfer coefficient on the horizontal plunge due to trapped bubbles. F) Measured cooling rate of nylon, stainless steel, and copper compared with thermal conductivity. The higher thermal conductivity of copper produces a higher cooling rate. G) Experimental and theoretical cooling rate of different mesh wire diameters. The scale bar in B and D is 1 cm.
