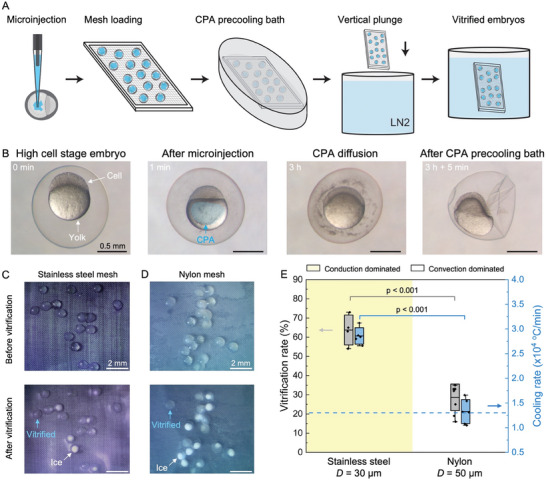
Figure 6.

Vitrification of zebrafish embryos. A) Schematic of zebrafish embryo vitrification protocol. B) Microscope images of zebrafish embryos at different stages of the protocol. The scale bar is 0.5 mm. C) Microscope images of zebrafish embryos before and after vitrification on stainless steel with D = 30 µm and Ф = 0.5. Embryos showing ice formation are white in color, while the vitrified embryos are transparent. D) Microscope images of zebrafish embryos before and after vitrification on nylon with D = 50 µm and Ф = 0.5. The scale bars for (C) and (D) are 2 mm. E) Vitrification rate and experimental cooling rate of stainless steel and nylon mesh with vertical plunge. Yellow‐colored area shows conduction‐dominated cryomesh cooling. Gray boxes represent standard deviation of survival rates. Blue boxes represent standard deviation of simulated cooling rate. Horizontal dash line is the estimated threshold cooling rate, which is higher than the CCR of zebrafish embryos. The conduction‐dominated cryomesh has a higher vitrification rate due to a higher cooling rate.
