Figure 2.

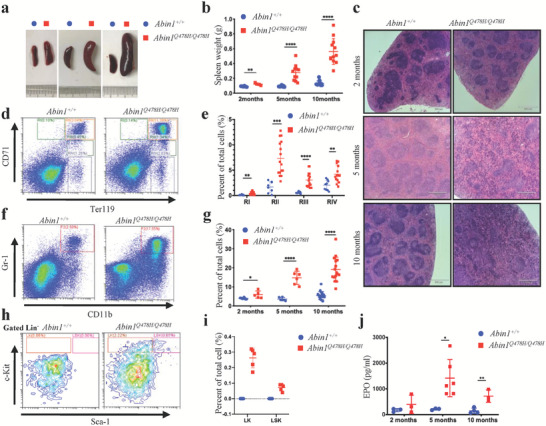
Abin1Q478H/Q478H mice developed hematopoietic defects. a–b) Different sizes (a) and weights (b) of the spleens of wild‐type (WT) and Abin1Q478H/Q478H mice at the indicated age. (n ≥ 5 mice/group) c) Hematoxylin and eosin staining of the spleen. Scale bar, 560 µm. Representative of at least three similar‐aged mice at the indicated age per group. d,e) Representative flow cytometry profiles (d) and quantification of the frequencies (e) of the spleen cells of 10‐month‐old WT and Abin1Q478H/Q478H mice at the indicated erythroid differentiation stages (RI, proerythroblasts; RII, basophilic erythroblasts; RII, chromatophilic erythroblasts; RIV, orthochromatophilic erythroblasts). (n ≥ 5 mice/group) f,g) Representative flow cytometry profiles (f) and quantification of the frequencies (g) of the myeloid (CD11b+ and Gr1+) cells in the spleens of WT and Abin1Q478H/Q478H mice at the indicated age. (n ≥ 5 mice/group) h,i) Representative flow cytometry profiles (h) and quantification of the frequencies (i) of the lineage‐negative‐Kit+ (LK) and lineage‐negative‐Sca1+‐Kit+ (LSK) cells in the spleens of 10‐month‐old WT and Abin1Q478H/Q478H mice. (n ≥ 5 mice/group) j) Serum erythropoietin (EPO) levels of WT and Abin1Q478H/Q478H mice at the indicated age. (n ≥ 3 mice/group) The panel data were analyzed using the two‐tailed unpaired Student t‐test, and statistical significance was indicated as follows: **** for P < 0.0001, *** for P < 0.001, ** for P < 0.01, and * for P < 0.05.
