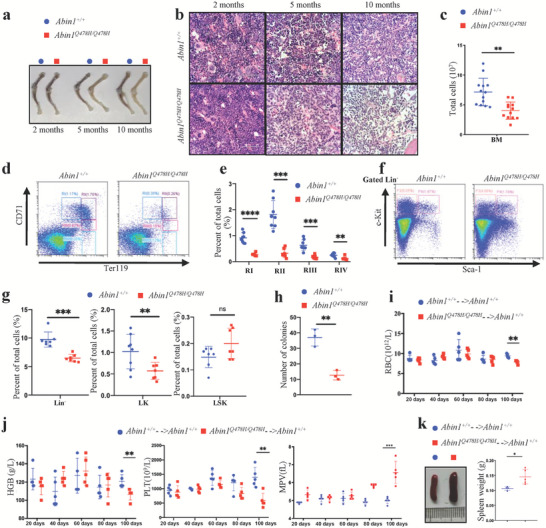
Figure 3.

Abin1Q478H/Q478H mice developed bone marrow failure. a) Femur and tibia of wild‐type (WT) and Abin1Q478H/Q478H mice at the indicated age. Representative of at least three mice per group. b) Hematoxylin and eosin staining images of bone marrow (BM). Representative of at least three mice at the indicated age per group. c) Reduced total BM cells in 5‐month‐old WT and Abin1Q478H/Q478H mice. BM cells from 2 femurs and 2 tibias were harvested from 5‐month‐old WT and Abin1Q478H/Q478H mice. (n ≥ 12 mice/group) d,e) Representative flow cytometry profiles (d) and quantification of the frequencies (e) of the BM cells of 5‐month‐old WT and Abin1Q478H/Q478H mice at the indicated erythroid differentiation stages (RI, proerythroblasts; RII, basophilic erythroblasts; RII, chromatophilic erythroblasts; RIV, orthochromatophilic erythroblasts). (n ≥ 7 mice/group) f) Representation flow cytometry profiles of lineage‐negative‐Kit+ (LK) and lineage‐negative‐Sca1+‐Kit+ (LSK) BM cells of 5‐month‐old WT and Abin1Q478H/Q478H mice. g) Quantification of the frequencies of Lin–, LK, and LSK BM cells of the 5‐month‐old WT and Abin1Q478H/Q478H mice. (n ≥ 7 mice/group) h) Quantification of the total colony number in colony‐forming unit (CFU) assays. LSK (1 × 10³) cells isolated from 5‐month‐old WT and Abin1Q478H/Q478H BM cells were plated for each assay. (n ≥ 3 mice/group) I,j) Peripheral blood analysis of the 2‐month‐old WT and Abin1Q478H/Q478H BM cell‐recipient mice, including red blood cell (RBC) count (i), hemoglobin (HGB) level, platelet (PLT) count, and mean platelet volume (MPV) (j). (n ≥ 4 mice/group) k) Different sizes and weights of the spleens of the 2‐month‐old WT and Abin1Q478H/Q478H BM cell‐recipient mice at 100 days after cell transplantation (n ≥ 4 mice/group) The panel data were analyzed using the two‐tailed unpaired Student t‐test, and statistical significance was indicated as follows: **** for P < 0.0001, *** for P < 0.001, ** for P < 0.01, and * for P < 0.05.
