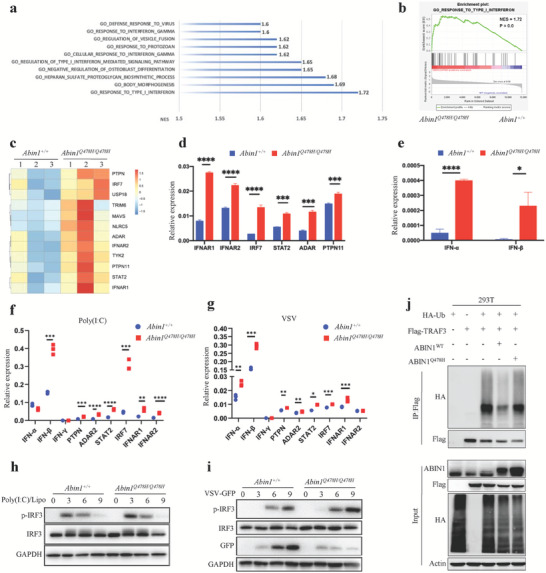
Figure 6.

Enhanced expression of type I interferons in Abin1Q478H/ Q478H bone marrow cells. a) Gene set enrichment analysis (GSEA) of enriched Gene Ontology (GO) terms for biological processes in lineage‐negative (Lin–) bone marrow (BM) cells from 5‐month‐old wild‐type (WT) and Abin1Q478H/Q478H mice. b) GO terms of the “response to type I interferon” in Lin– BM cells from 5‐month‐old WT and Abin1Q478H/Q478H mice. c) Differentially expressed genes related to type I interferon (IFN) were identified through expression profiling of Lin– BM cells from 5‐month‐old WT and Abin1Q478H/Q478H mice. d) qPCR analysis of representative type I interferon‐related genes in Lin– BM cells from 5‐month‐old WT and Abin1Q478H/Q478H mice. e) qPCR analysis of IFNα and IFNβ in Lin– BM cells from 5‐month‐old WT and Abin1Q478H/Q478H mice. f) Expression of type I IFN‐related genes was assessed by qPCR in bone marrow‐derived macrophages (BMDMs) from WT and Abin1Q478H/Q478H mice transfected with poly(I:C) for 4 h. g) Immunoblot analysis of phosphorylated and total IRF3 in whole‐cell lysates of WT and Abin1Q478H/Q478H BMDMs transfected with poly(I: C) at the indicated time points. h) qPCR‐assessed expression of type I IFN‐related genes in BMDMs from WT and Abin1Q478H/Q478H mice infected with vesicular stomatitis virus (VSV) for 4 h. i) Immunoblot analysis of phosphorylated and total IRF3 in whole‐cell lysates of WT and Abin1Q478H/Q478H BMDMs infected with VSV at the indicated time points. j) TRAF3 ubiquitination in 293T cells transfected with the indicated expression vectors, as assessed by immunoblot analysis with anti‐HA after immunoprecipitation with anti‐FLAG or by immunoblot analysis with input proteins in lysates without immunoprecipitation. The panel data were analyzed using the two‐tailed unpaired Student t‐test, and statistical significance was indicated as follows: **** for P < 0.0001, *** for P < 0.001, ** for P < 0.01, and * for P < 0.05.
