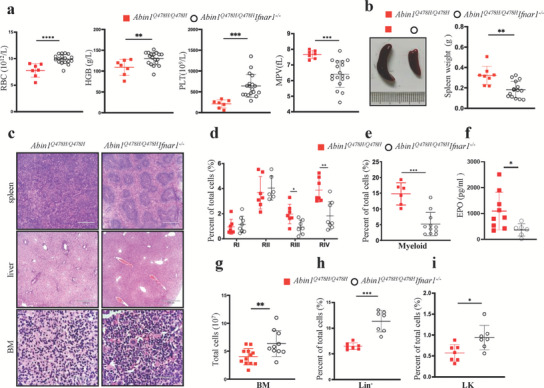
Figure 7.

High‐level expression of type I interferons contributed to hematopoietic deficiencies development in Abin1Q478H/Q478H mice. a) Peripheral blood analysis of 5‐month‐old Abin1Q478H/Q478H and Abin1Q478H/Q478HIfnar1–/– mice, including red blood cell (RBC) count, hemoglobin (HGB) level, platelet (PLT) count, and mean platelet volume (MPV). (n ≥ 7 mice/group) b) Different size and weight of the spleens of 5‐month‐old Abin1Q478H/Q478H and Abin1Q478H/Q478HIfnar1–/– mice. c) Hematoxylin and eosin staining of spleen, liver, and bone marrow (BM) samples. Representative of at least three 5‐month‐old mice per group. (n ≥ 8 mice/group) d) Quantification of the frequencies of the spleen cells of the 5‐month‐old Abin1Q478H/Q478H and Abin1Q478H/Q478HIfnar1–/– mice at the indicated erythroid differentiation stages (RI, proerythroblasts; RII, basophilic erythroblasts; RII, chromatophilic erythroblasts; RIV, orthochromatophilic erythroblasts). (n ≥ 6 mice/group) e) Quantification of the myeloid (CD11b+ and Gr1+) frequencies of the 5‐month‐old Abin1Q478H/Q478H and Abin1Q478H/Q478HIfnar1–/– mouse spleens. (n ≥ 6 mice/group) f) Serum erythropoietin (EPO) level in 5‐month‐old Abin1Q478H/Q478H and Abin1Q478H/Q478HIfnar1–/– mice. (n ≥ 6 mice/group) g) Total BM cells from 2 femurs and 2 tibias were harvested from 5‐month‐old Abin1Q478H/Q478H and Abin1Q478H/Q478HIfnar1–/– mice. (n ≥ 10 mice/group) h) Quantification of the frequencies of lineage‐negative (Lin–) BM cells in the 5‐month‐old Abin1Q478H/Q478H and Abin1Q478H/Q478HIfnar1–/– mice. (n ≥ 7 mice/group) i) Quantification of the frequencies of the LK BM cells in the 5‐month‐old Abin1Q478H/Q478H and Abin1Q478H/Q478HIfnar1–/– mice. (n ≥ 7 mice/group) The panel data were analyzed using the two‐tailed unpaired Student t‐test, and statistical significance was indicated as follows: **** for P < 0.0001, *** for P < 0.001, ** for P < 0.01, and * for P < 0.05.
