
Figure 1.
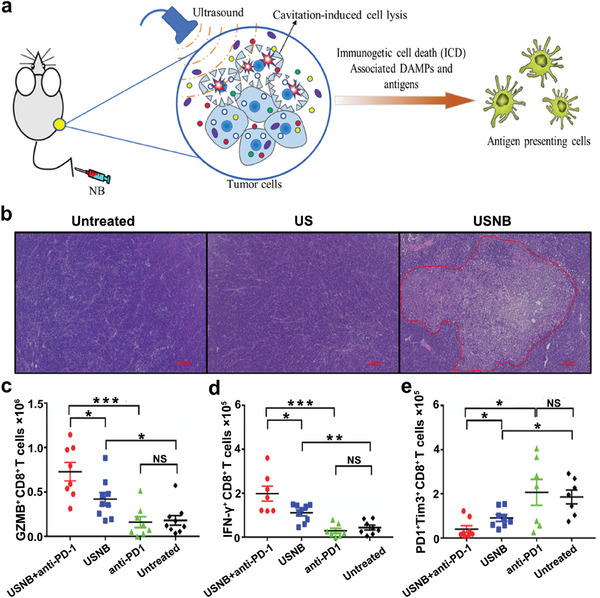
a) Schematic diagram illustrating the impacts of UTNB upon a mouse tumor model. b) H&E staining of tumor tissues after different treatments. c–e) The populations of GZMB+CD8+ T, IFN‐γ+CD8+ T, and PD1+Tim3+CD8+ T cells in different groups. Adapted with permission.[ 54 ] Copyright 2022, BMJ Publishing Group Ltd. * p< 0.05, ** p< 0.01, *** p< 0.001. NS, no significance.