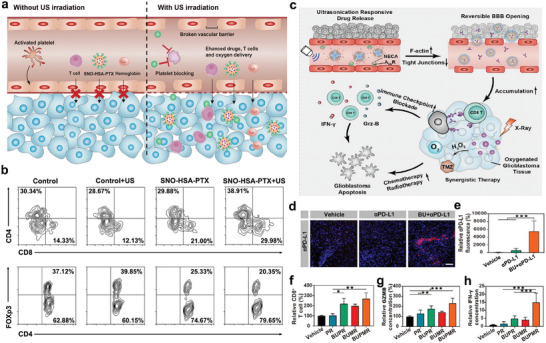
Figure 2.

a) Schematic illustration revealing the effects of SNO‐HSA‐PTX upon tumor vascular barrier. b) Flow cytometry analysis of intra‐tumoral CD4+ T, CD8+ T, and Treg (Foxp3+CD4+) cell infiltration. Reproduced with permission.[ 60 ] Copyright 2021, Dove Medical Press. c) Schematic diagram of targeted regulation of the blood‐brain barrier to improve the efficiency of chemoradiotherapy and immune checkpoint blocking in the treatment of glioblastoma. d,e) The accumulation of PD‐L1 in glioblastoma tissues was analyzed by immunofluorescence. f,g) The infiltration of CD8+ T cells in glioblastoma tissues after various treatments. g,h) The levels of GZMB and IFN‐γ analyzed by ELISA in different groups. Reproduced with permission.[ 76 ] Copyright 2021, American Chemical Society. * p< 0.05, ** p< 0.01, *** p< 0.001.
