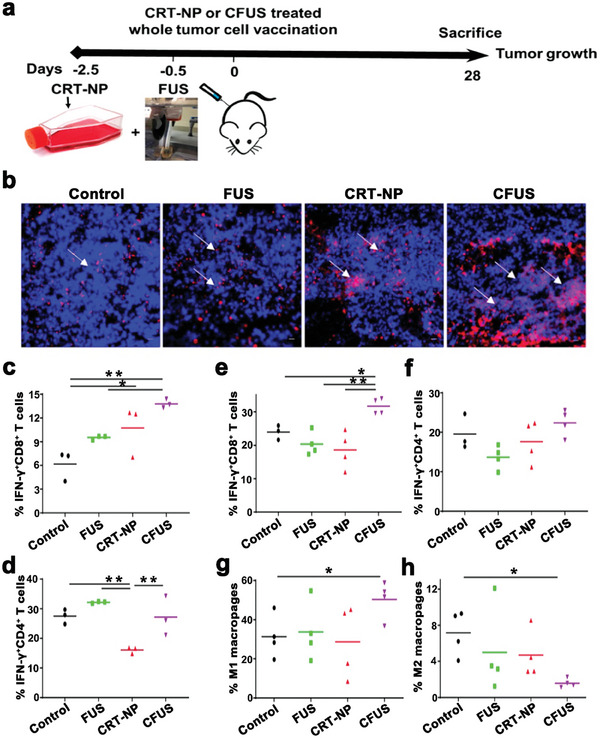
Figure 13.

a) Experimental schedule for the combination therapy of CRT‐NPs with FUS against melanoma. b) Representative immunofluorescence images of CRT in B16F10 melanoma tumor sections. c,d) The populations of IFN‐γ+CD8+ T cells and IFN‐γ+CD4+ T cells in tumors with different treatments. e–h) The populations of IFN‐γ+CD8+ T, IFN‐γ+CD4+ T cells, M1, and M2 macrophages in spleens with different treatments. Reproduced with permission.[ 138 ] Copyright 2020, IVYSPRING. * p< 0.05, ** p< 0.01.
