
Figure 2.
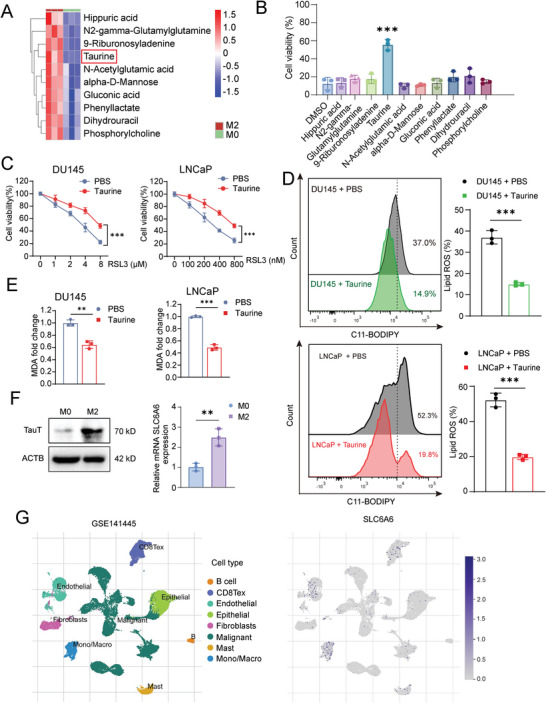
TAMs secrete taurine to suppress ferroptosis of PCa cells. A) Heatmap of top ten metabolites with significant differences in content between M0‐lCM and M2‐lCM using LC/MS assay. B) Cell viability of DU145 cells after treatment of ten metabolites for 24 h respectively following with the RSL3 treatment for another 24 h. The concentration used for each metabolite is listed in Table S2 (Supporting Information). C) Analysis of cell viability of PCa cells after incubated with taurine (100 µm) for 24 h following with the RSL3 treatment for another 24 h. D,E) Lipid peroxidation (D) and MDA level (E) of PCa cells after incubated with taurine (100 µm) for 24 h following with the RSL3 treatment for another 24 h. F) The mRNA and protein expression of TauT in M0 and M2 macrophage. G) Visualization of SLC6A6 gene expression in different cell types on a plot of scRNA‐seq profiles of human prostate cancer (GSE141445). Each experiment was performed in triplicate and independently repeated three times. (Two‐tailed Student's t‐test was used for the statistical analysis: **, p < 0.01; ***, p < 0.001. Data are presented as means ± SD, n = 3).