Figure 1.

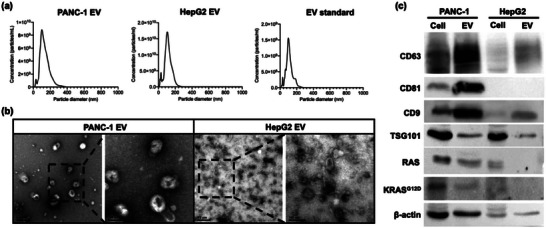
Characterization of EVs from PANC‐1 (pancreatic carcinoma), HepG2 cells (hepatocellular carcinoma), and a commercial EV standard (HBM‐HCT‐30/5, Hansabiomed). a) Nanoparticle tracking analysis (NTA) quantification and size distribution of particles contained in the sample. The modal particle size for PANC‐1 EVs was 112.1 ± 9.3 nm, with a concentration of 1.19 × 10¹² ± 1.63 × 10¹⁰ particles mL−1. For HepG2 EVs, the modal particle size was 93.9 ± 1.9 nm, with a concentration of 1.19 × 10¹² ± 3.49 × 10¹⁰ particles mL−1. For the EV standard, the modal particle size was 108.2 ± 7.6 nm, with a concentration of 1.07 × 10¹¹ ± 2.28 × 10⁹ particles mL−1. b) Transmission electron microscope (TEM) imaging revealed that both PANC‐1 EVs and HepG2 EVs exhibited cup‐ or spherical‐shaped morphologies with sizes less than 200 nm. c) Western blot analysis confirmed the presence of transmembrane protein markers (CD63, CD81, and CD9), luminal protein markers (TSG101, RAS, KRASG12D), and the positive control (β‐actin) in the isolated PANC‐1 EV and HepG2 EV samples, as well as their respective parental cell lysates. The amount of CD81, RAS, and KRASG12D in the HepG2 EV sample and its cell lysate was notably lower compared to the PANC‐1 samples.
