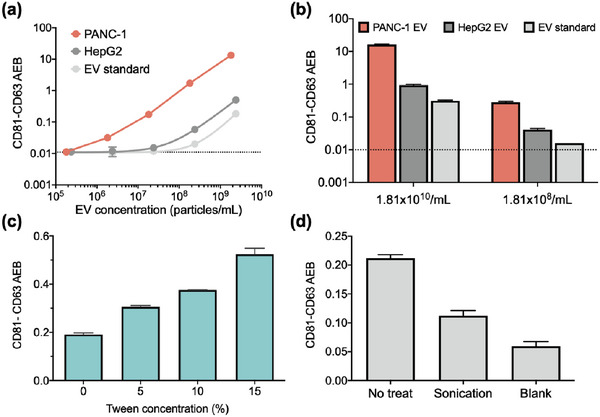
Figure 2.

Surface eSimoa pipeline. a) Standard curves of the CD81‐CD63 eSimoa assay using PANC‐1 EVs, HepG2 EVs, and the EV standard are shown. The LOD values of the assay were calculated to be 1.2 × 10 5 EV mL−1, 3.5 × 10⁶ EV mL−1, and 3.1 × 10⁷ EV mL−1 for PANC‐1, HepG2 EVs, and the EV standard, respectively. b) The CD81‐CD63 eSimoa assay was used to measure PANC‐1 EVs, HepG2 EVs, and the EV standard at two different EV concentrations. The results consistently showed that PANC‐1 EVs exhibited the highest CD81‐CD63 signals compared to HepG2 EVs and the EV standard. c) The EV standard was treated with various concentrations of Tween‐20 surfactant and the CD81‐CD63 signal was measured. d) The EV standard was ultrasonically treated and the CD81‐CD63 signal was measured. All measurements were performed in duplicate. The dotted lines locate the LOD of the assay.
