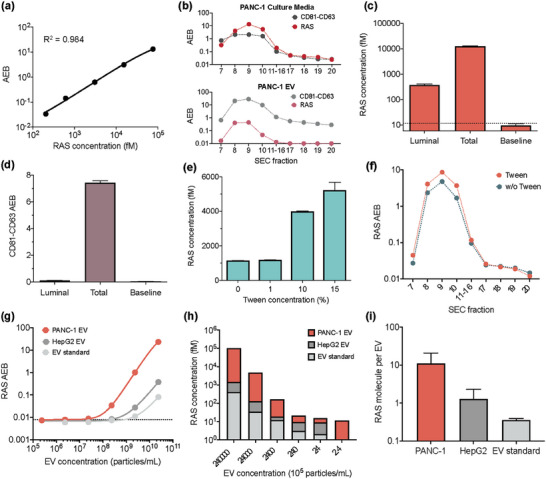
Figure 3.

Pan‐RAS eSimoa assay in the luminal eSimoa pipeline. a) The standard curve of the pan‐RAS Simoa assay. The LOD value of the assay was 0.10 pg mL−1 (4.7 fm). b) eSimoa quantification of CD81‐CD63 and RAS levels in SEC fractions of PANC‐1 culture media (top) and the purified PANC‐1 EV sample (bottom). The pinky region (fractions 7–10) was defined as “EV fractions”. Fractions 17–20 were defined as “soluble protein fractions”. c,d) The proteinase method decodes sublocalization of RAS or CD81‐CD63 proteins within PANC‐1 EVs using the pan‐RAS or CD81‐CD63 eSimoa assays, respectively. Luminal: EVs were treated with proteinase K, followed by lysis of the EVs using Tween after proteinase inactivation. Total: the positive control group consists of EVs without proteinase treatment. Baseline: the negative control group in which EVs were treated with proteinase without instant proteinase inactivation. e) PANC‐1 EV samples were treated with 1%, 10%, or 15% Tween. The RAS concentrations were quantified using eSimoa. f) Comparison of RAS levels in the SEC fractions between two groups: PANC‐1 EVs treated with 5% Tween and without Tween treatment. g,h) RAS protein levels quantified in different concentrations of lysed PANC‐1 EVs, HepG2 EVs, and the EV standard. The LOD values were 1.7 × 10⁷ EV mL−1 for PANC‐1 EVs, 2.6 × 10⁸ EV mL−1 for HepG2 EVs, and 1.1 × 10⁹ EV mL−1 for the EV standard. (i) The average RAS molecules per EV were estimated to be 11.2, 1.30, and 0.36 RAS molecules per EV for PANC‐1 EVs, HepG2 EVs, and the EV standard, respectively. All measurements were performed in duplicate. The dotted lines locate the LOD of the assay.
