Figure 6.

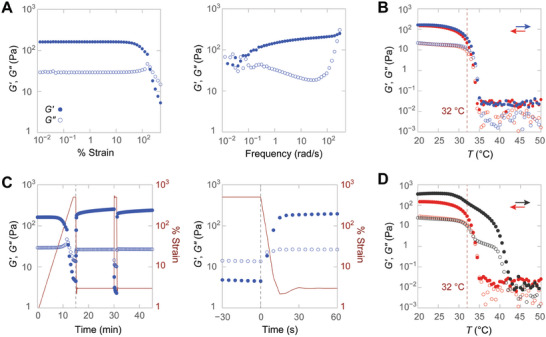
Rheology of 11/3sb‐OKD hydrogels. Closed (⬤) and open circles (○) report storage and loss moduli in all panels. A) Strain (at 3 rad/s) and frequency sweeps (at 1% strain) of a 1.0% w/v hydrogel. B) Temperature denaturation (blue) and subsequent annealing (red) of a 1.0% w/v OKD hydrogel reveal a transition profile consistent with CD data. The temperature response was monitored at 1% strain and 3 rad/s in all experiments. The value of T m determined by CD spectroscopy is indicated (dashed line). C) Fast recovery of the hydrogel after 500% strain. Moduli (blue) and strain (red) are shown over time. The dashed line identifies an identical time point between the two panels. D) Temperature denaturation (black) and subsequent annealing (red) of a previously deformed 1.0% w/v OKD hydrogel highlight its elevated thermostability after deformation.
