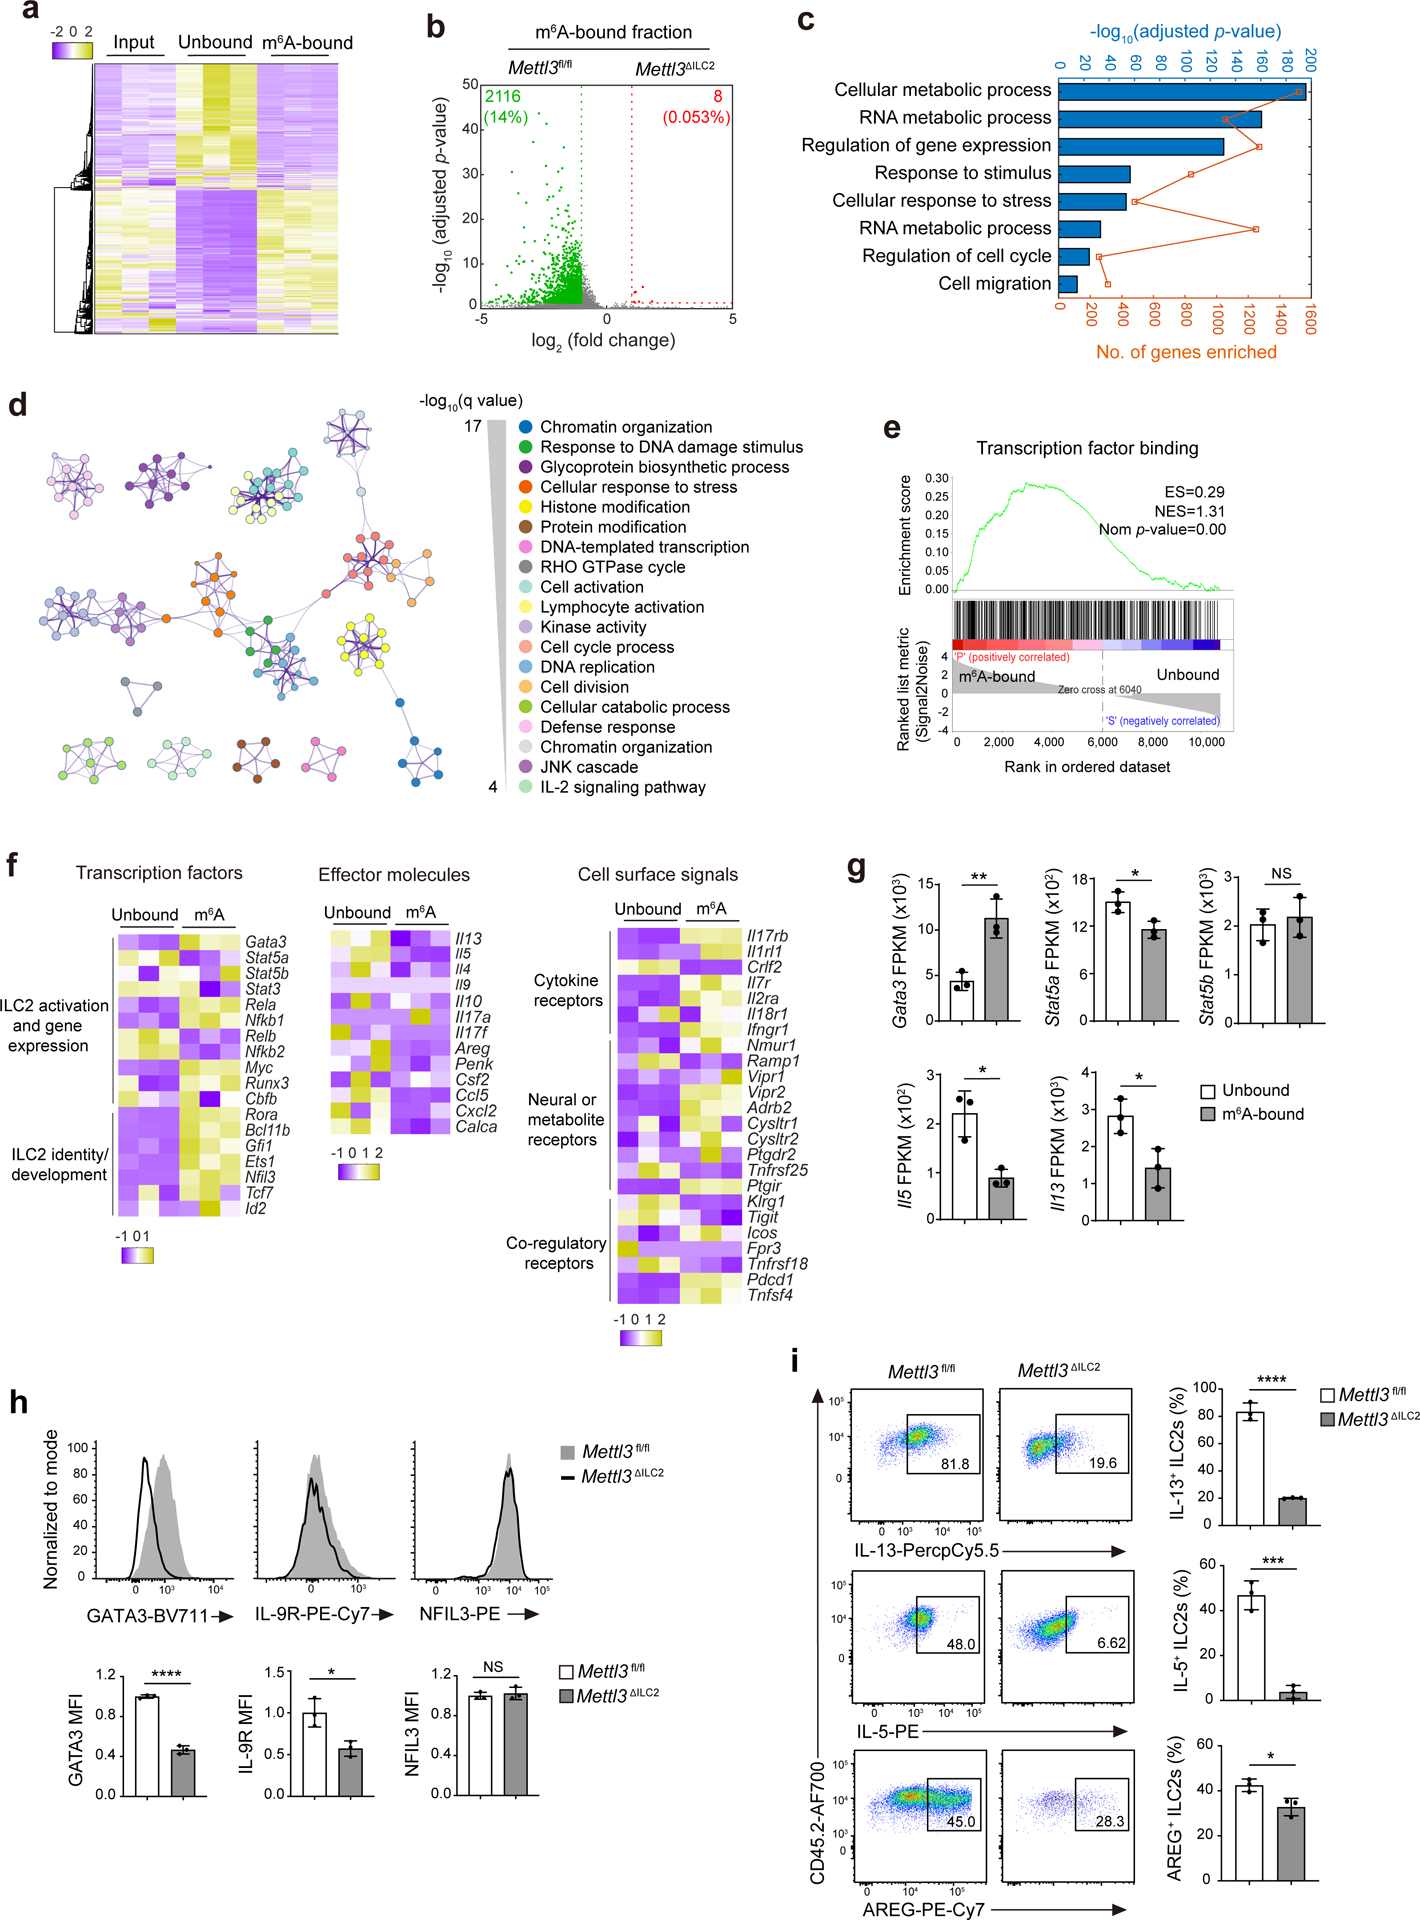
Fig. 4. m6A targets Gata3 in activated ILC2s.

a, Heat map of DEseq2-normalized read counts of meRIP–seq data from iILC2s sorted from MLNs of IL-25-treated B6 mice. Input, total mRNA; unbound, unmethylated; m6A bound, m6A methylated. b, Volcano plot for the comparison of genes enriched in the m6A-bound fraction between Mettl3fl/fl ILC2s and Mettl3ΔILC2 ILC2s from the small intestine of untreated mice. c, Functional enrichment analysis on the m6A-bound fraction in a as assessed by gProfiler. d, Metascape analysis of the m6A-bound fraction in a. Each node represents a functional term. The size of the node is proportional to the number of m6A-bound genes that fall into the corresponding term, and the color reflects its cluster identity. The edge represents the similarity between the two terms. e, Enrichment plot of gene sets that were enriched in the m6A-bound fraction in a; ES, enrichment score; NES, normalized enrichment score; Nom, nominal. f,g, Heat map (f) and fragments per kilobase per million (FPKM; g) of selected genes between unbound and m6A-bound fractions as in a. In g, **P = 0.0071 (Gata3), *P = 0.0237 (Stat5a), NS P = 0.6370 (Stat5b), *P = 0.0106 (Il5) and *P = 0.0259 (Il13). h, Representative flow cytometry and mean fluorescence intensity (MFI) quantification of GATA3, IL-9R and NFIL3 in small intestine ILC2s from Mettl3fl/fl and Mettl3ΔILC2 mice that received 2 d of IL-25 treatment; ****P < 0.0001 (GATA3); *P = 0.0185 (IL-9R); NS P = 0.6008 (NFIL3). i, Representative flow cytometry and quantification of the percentage of IL-13+, IL-5+ and AREG+ ILC2s as in h; ****P < 0.0001 (IL-13); ***P = 0.0005 (IL-5); *P = 0.0244 (AREG). Data were analyzed by unpaired two-tailed t-test; n = 3 in g–i. Data are shown as mean ± s.d. Results are representative of two independent experiments in h and i.
