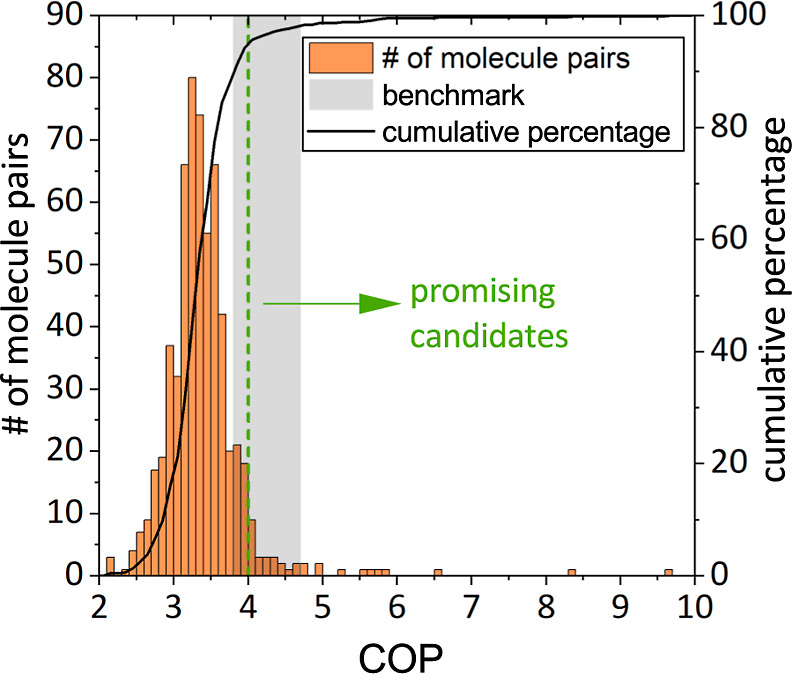
Figure 3.

Histogram (orange, bin width = 0.1) and cumulative percentage distribution of COP (black line) for the 606 molecule pairs. The gray area represents the benchmark (vapor-compression refrigeration, COP = 3.8–4.7); promising molecule pairs have a COP greater than 4.0 (green dashed line).
