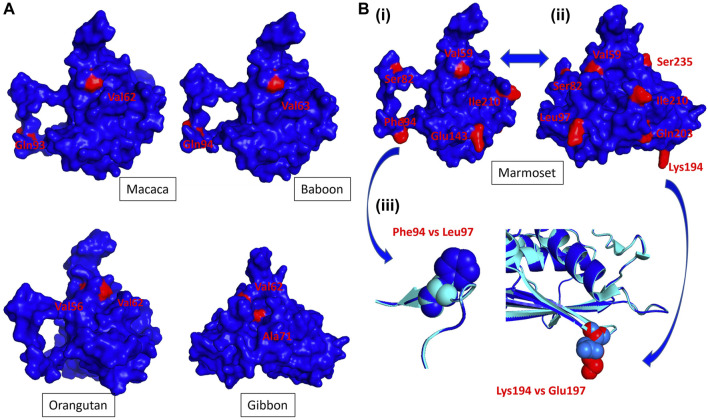
FIGURE 2.
The NHP Trop-2 protein structure. NHP 3D structures were modeled versus the crystal structure of the human Trop-2 (Pavšič, 2021), following the described procedures (Materials and Methods). The 3D modeling parameters are listed in Supplementary Table S1. Polymorphic residues versus the human Trop-2 sequence are in red. (A) Side (macaca, baboon, orangutan) and frontal (gibbon) views of primate Trop-2s (Supplementary Table S1). The 3D model surface representation was obtained with PyMol (Supplementary Table S1). (B) (i) Side and (ii) frontal views of the marmoset Trop-2 3D structure. (iii) Overlap of the human and marmoset Trop-2 is in ribbon/contour diagrams. Alpha helices, beta sheets (flat arrows) and loops are shown. The ribbon diagram of marmoset Trop-2 is in blue; that of the human Trop-2 is in cyan. (blue arrows) Phe94 in marmoset versus Leu97 in human and Lys194 in marmoset versus Glu197 in human are magnified.

