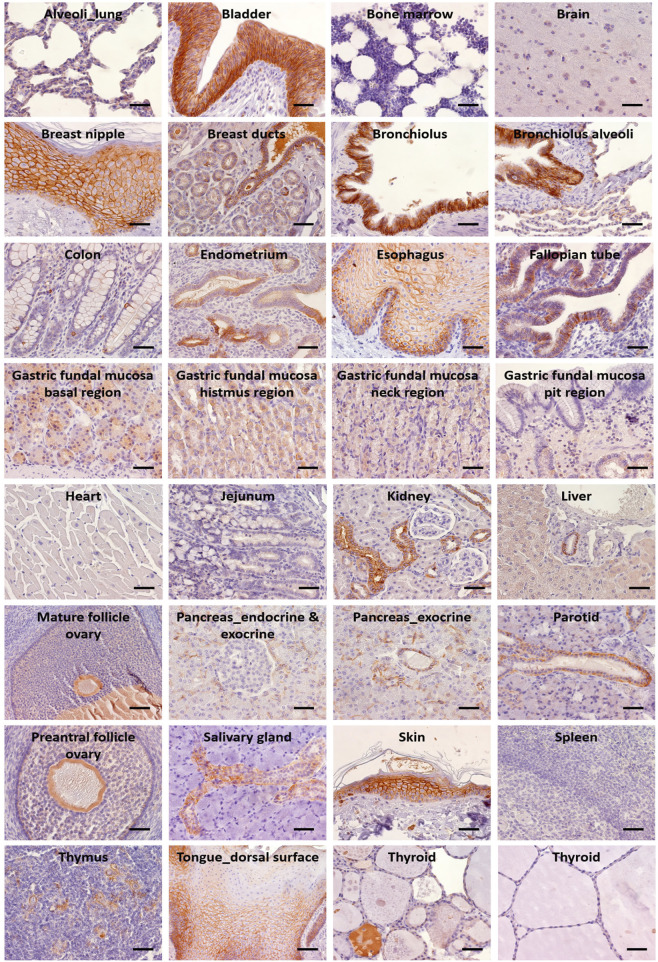
FIGURE 4.
IHC analysis of Trop-2 protein expression in rhesus monkey tissues. Staining was performed with the AF650 anti-Trop-2 goat pAb. Individual organs are indicated. Brown staining reveals Trop-2 expression. Trop-2 expression was quantified as percentage of stained cells and as intensity of the staining. An IHC positivity score was determined according to five categories: 0 (0% of positive cells), 1 (<10% of positive cells), 2 (10%–50% of positive cells), 3 (50%–80% of positive cells), 4 (>80% of positive cells). An intensity score classified the average intensity of the positive cells as 1 (weak staining), 2 (moderate staining) or 3 (strong staining) (Supplementary Table S2). Bars: 50 µm.

