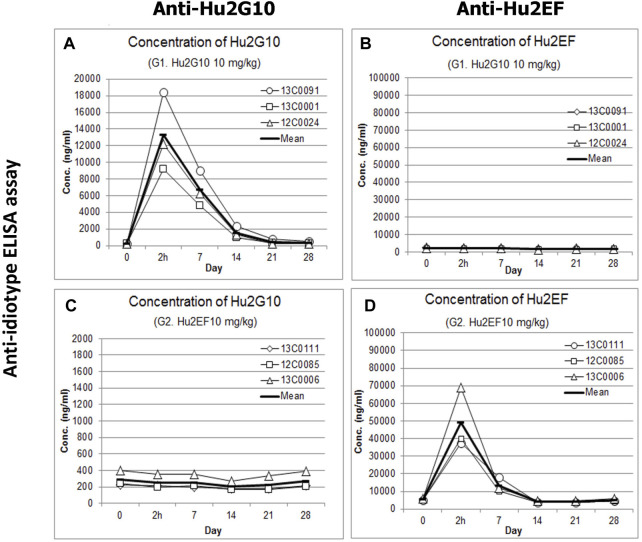
FIGURE 6.
Pharmacokinetics of Hu2G10 and Hu2EF in cynomolgus monkey. Three individual cynomolgus monkeys for each experimental group received an intravenous infusion of 10 mg/Kg of Hu2G10 or 10 mg/Kg of Hu2EF or 5 mg/Kg of Hu2G10 plus 5 mg/Kg of Hu2EF at day 0. Blood serum concentrations of Hu2G10 and Hu2EF were measured by ELISA capture assays with anti-idiotypic antibodies (Supplementary Materials and Methods) at the indicated time points, over 28 days after mAb injection. Absolute parameter values are reported in Supplementary Table S3. The curves displaying average determinations (mean values of replica wells) are in bold. Standard curves of Hu2G10 and Hu2EF progressive dilutions, as included in individual ELISA assay plates, were used as reference (Supplementary Table S3). (A, B) Blood serum concentrations of Hu2G10 and Hu2EF, respectively, in the experimental group receiving 10 mg/kg of Hu2G10. (C, D) Blood serum concentrations of Hu2G10 and Hu2EF, respectively, in the experimental group receiving 10 mg/kg of Hu2EF.

