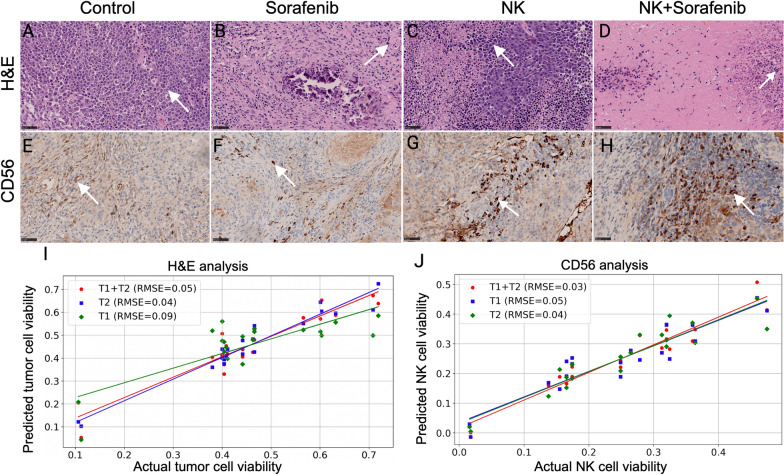
Fig. 5.
Histological Analysis of HCC Treatments with H&E and CD56 Staining. Arrow shows the tumor cell (dark pink) and NK cell (dark brown). A–D H&E-stained histological sections revealing the tumor cell viability for the (A) control group, (B) sorafenib treatment, (C) NK cell IHA treatment and (D) combination therapy. E–H CD56-stained sections highlighting NK cell activity for the (E) control group, (F) sorafenib treatment, (G) NK cell IHA treatment, and (H) combination therapy. I, J Correlation curves between MRI features and both (I) H&E and (J) CD56 histological biomarkers

