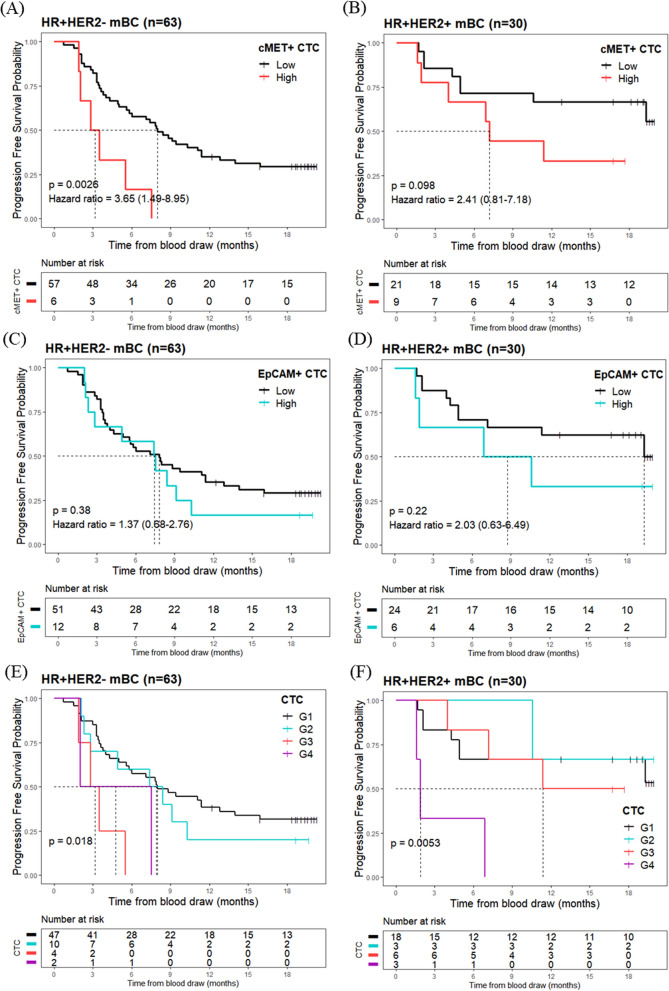
Fig. 2.
Progression-free survival (PFS) analysis based on EpCAM+ or c-MET+ CTC count. Kaplan–Meier curves of PFS according to the level of c-MET+ CTC in A HR+/HER2−, B HR+/HER2+, or EpCAM+ CTC in patients with C HR+/HER2− and D HR+/HER2+ mBC. For combined analysis of the EpCAM+ and c-MET+ CTC, patients were classified into four groups: c-MET+ CTC low/EpCAM+ CTC low (G1), c-MET+ CTC low/EpCAM+ CTC high (G2), c-MET+ CTC high/EpCAM+ CTC low (G3), and c-MET+ CTC high/EpCAM+ CTC high (G4) in HR+ /HER2− (E) or HR+/HER− (F). PFS was calculated as the time from blood draw to either disease progression or death during standard therapy. CTCs, circulating tumor cells; HR, hormone receptor; mBC, metastatic breast cancer

