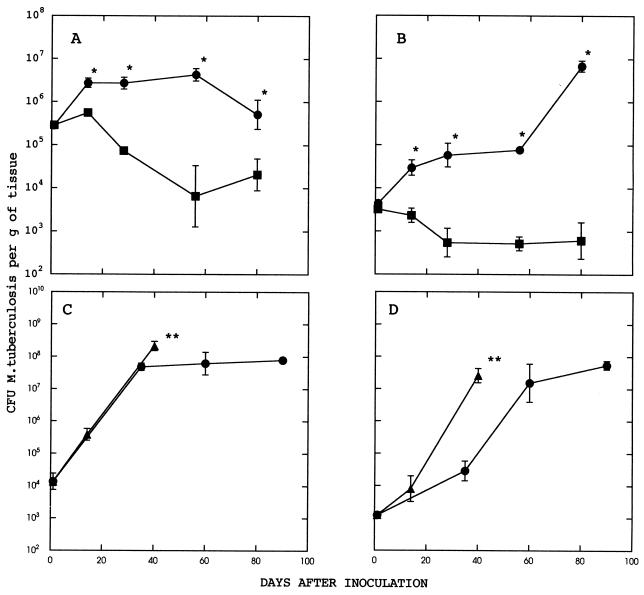
FIG. 1.
Growth of M. tuberculosis in the tissues of MHC class II knockout, control, and athymic mice. (A and B) Growth in spleens and lungs, respectively, of MHC class II knockout mice (•) and their wild-type littermates (▪). (C and D) Growth in spleens and lungs, respectively, of MHC class II knockout (•) and athymic (▴) mice. Data are the geometric means ± the standard errors of the means for three to five mice. An asterisk indicates a significant difference between values for MHC class II knockout and control mice (P < 0.05 by Students’ t test). A double asterisk denotes that at the indicated time, all remaining mice in the group were killed because of the widely disseminated nature of the infection.

