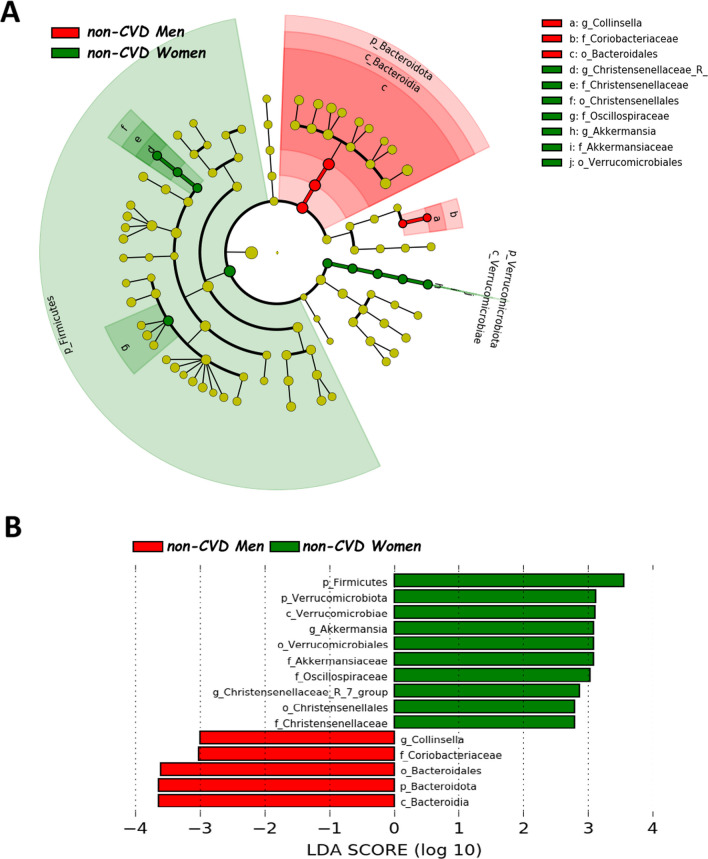
Fig. 2.
Differently abundant taxa in non-CVD patients according to the sex, based on LEfSe analysis. The colors represent the group in which the indicated taxa are more abundant compared to the other group. In a taxonomic cladogram, each successive circle represents a different phylogenetic level. A Cladogram: the order from the center to the outside is phylum, class, family and genus levels. Differing taxa are listed on the right side of the cladogram. B Linear discriminant analysis. The most differently abundant taxa between sexes are represented in a bar graph according to the LDA score (log 10), an estimation of the effect size. Only taxa meeting a P < 0.05 and LDA score significant threshold |> 2| are shown. g_UBA1819: g_UBA1819 (Ruminococcaceae); g_Incertae Sedis: Ruminococcaceae incertae sedis; f_UCG_010: f_UCG_010 (Oscillospirales). non-CVD non-cardiovascular disease individuals

