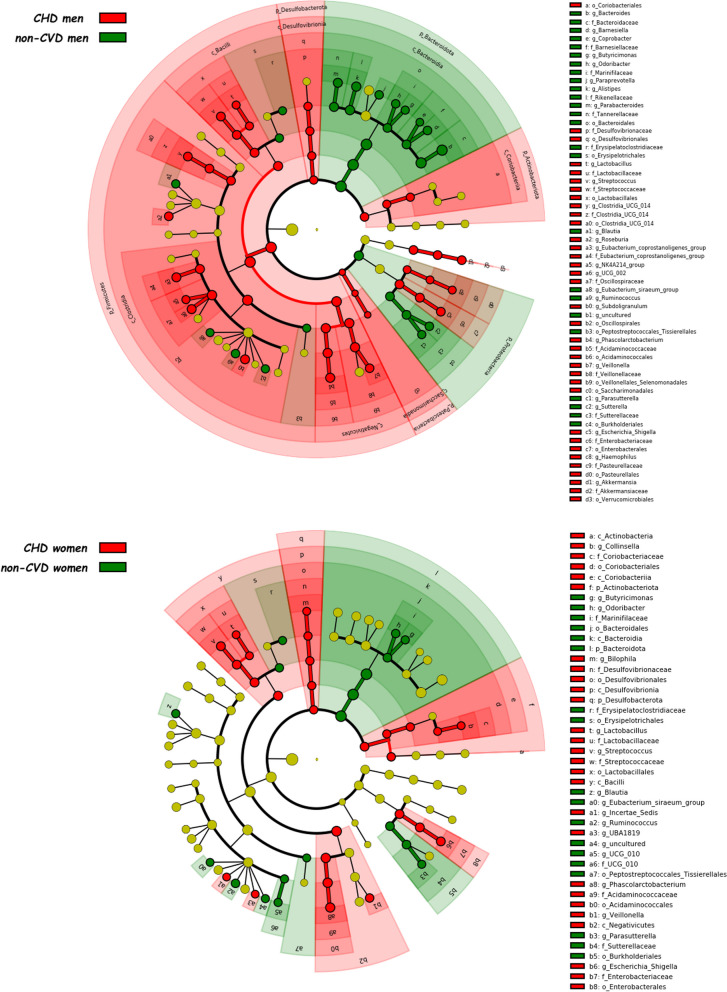
Fig. 3.
Differently abundant taxa between CHD patients and non-CVD subjects in men and women separately identified using LEfSe analysis. The colors represent the group in which the indicated taxon is more abundant compared to the other group. In a taxonomic cladogram, each successive circle represents a different phylogenetic level. The order from the center to the outside is phylum, class, family and genus levels. Differing taxa are listed on the right side of the cladogram. CHD coronary heart disease patients, non-CVD non-cardiovascular disease individuals

