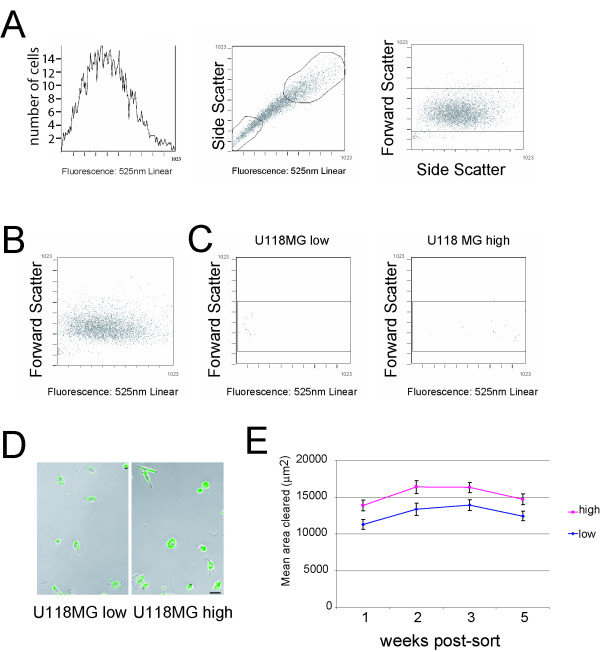
Figure 4.
Flow-cytometric sorting of cells based on motility. (A) Fluorescence distribution of U118MG resembles distribution of cell motility seen in phagokinetic motility assay (left). The y-axis represents the number of cells characterized in each bin; the x-axis represents cell fluorescence at 525 nm. An untransformed linear scale for fluorescence intensity is used. On a linear scale, the voltage measured (signal intensity) is directly proportional to the channel into which the event falls. A cell with a linear value of 100 is 10 times brighter than one in with a linear value of 10. Side-scatter and fluorescence characterization of U118MG after 20 hours of migration on fluorescent microspheres (middle). Cells were sorted using the gates drawn. Granularity (side scatter) reflects the quantity of ingested beads, and is directly related to cell fluorescence. 1023 channels are available to bin the signal from fluorescence, forward, and side scatter. Forward scatter (a measure of cell size) and side scatter (a measure of cell granularity) characterization of U118MG indicates that there is no relationship between cell size and bead internalization (right). (B) Cell size is not related to cell fluorescence. Forward scatter vs. fluorescent signal of analyzed cells show no relationship between cell size and fluorescence (left). (C) Flow characterization of sorted cells. A small sample of recovered cells were re-analyzed after sorting with gates shown in (A), and both gated populations (low and high fluorescence) show no relationship between cell size (forward scatter) and cell fluorescence. (D) Images of low fluorescence cells (left) and high fluorescence cells (right) 24 hours post sorting, plated onto tissue culture plastic treated with 50 μM poly-D-lysine. Bar = 20 μm. (E) Cells retain differences in motility when reassayed after one, two, three, and five weeks post-sort (n >100 cells/cell line at each time point). Cell motility was assayed by measuring the area cleared/cell over 24 hours using the fluorescent phagokinetic assay. The overall mean fold difference between the two cell lines is 1.20, p = 0.0230. The mean motility of the high motility cell line was significantly different than the low motility cell line at each time point measured (week 1, 1.23 fold difference, p = 0.0106; week 2, 1.23 fold difference, p = 0.0105; week 3, 1.17 fold difference, p = 0.0195; week 5, 1.18 fold difference, p = 0.0201). Results are expressed as means +/- SEM, and statistical significance was evaluated by Student's t-test at each time point.

