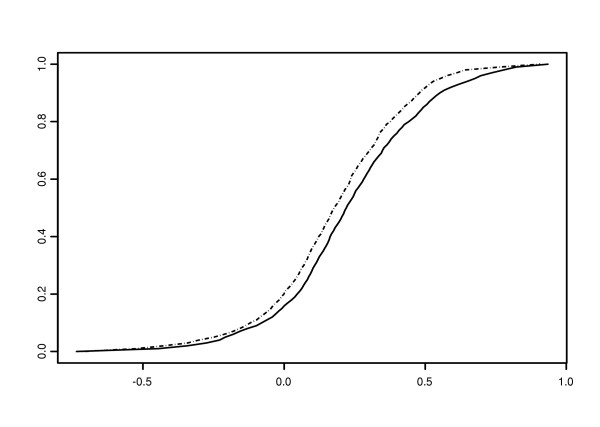
Figure 3.
Comparison of the empirical cumulative distributions of the two samples. The x-axis indicates the pair-wise correlation. The y-axis indicates the empirical cumulative distribution of the pair-wise correlation. The solid line is for the correlations between genes sharing one regulator and being in the same deacetylation partition group (the 1,811-pair sample). The dotted line is for the correlations between genes sharing one regulator and belonging to neighboring deacetylation partition groups (the 1,019-pair sample).

