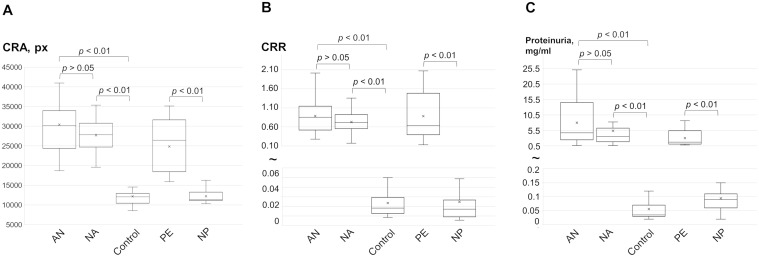
Fig 2. The results of the CRD tests and proteinuria levels in studied groups.
The values of congophilia observed in the paper (A) and membrane (B) tests, as well as the levels of proteinuria (C), are shown. The box plots present the 25th and 75th percentiles (box), the maximum and minimum values, the median (line in the box), and the mean (cross). AN, amyloid nephropathies; Control, patients without proteinuria; CRA, Congo red area; CRR, Congo red retention; NA, non-amyloid nephropathies; NP, normal pregnancy; PE, preeclampsia.

