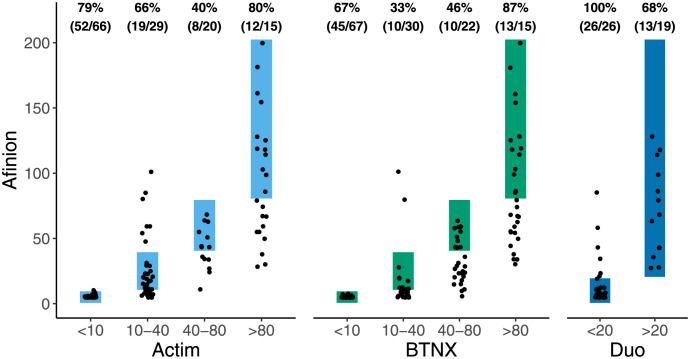
Fig 2. Agreement between RDTs with Afinion.
Measured in 130 (Actim), 134 (BTNX), and 50 (Duo) participants. Points inside rectangles indicate perfect agreement between tests. Percentages represent the number of samples classified correctly by the RDT (numerator) divided by the number of samples in that category as classified by Afinion (denominator).

