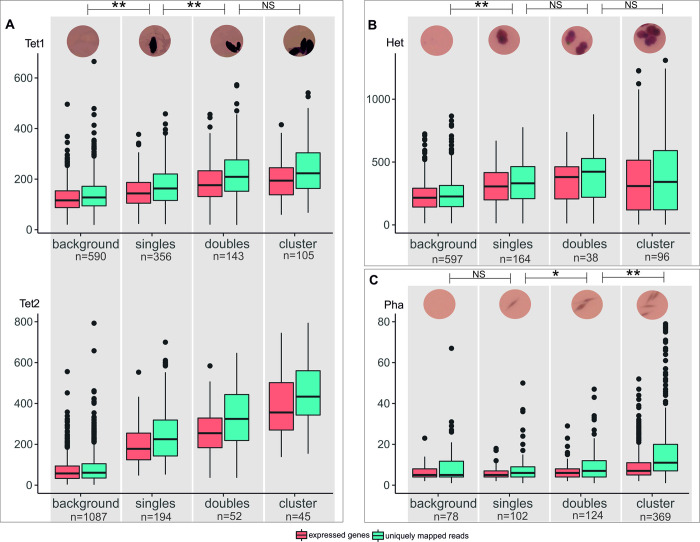
Fig 2. Number of expressed genes and unique transcripts per spot for different spot categories.
Background (empty spots), singles (one cell), doubles (two cells) and clusters (>2 cells) are identified based on the microscopic images and MASC-seq sequencing libraries of A) T. thermophila (two libraries; Tet1 and Tet2), B) Heterocapsa sp. (Het) and C) P. tricornutum (Pha). An example image of a spot is shown above each spot category and species. The number of spots (n) for each category and library are given. Significance levels of Wilcoxon rank-sum tests comparing number of unique transcripts per spot between pairs of spot categories are indicated, with * = p-value < 0.05; ** = p-value < 0.0001; and NS = non-significant.

