
Figure 11.
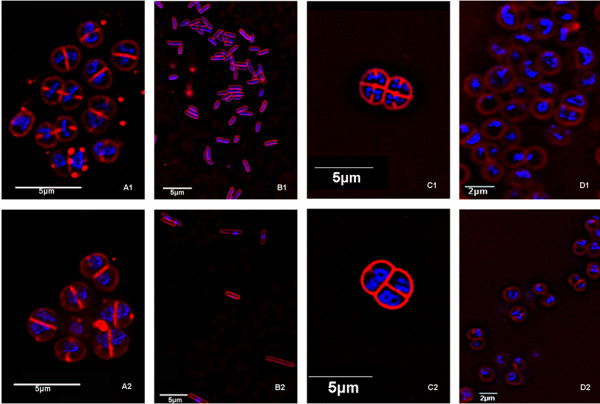
The nucleoid of deinococcal strains and E. coli 2 hrs after exposure to 5000Gy γ radiation. A1 – projection image of D. radiodurans R1 control cells; A2 – projection image of D. radiodurans R1 irradiated cells; B1 – 2D image of E. coli control cells; B2 – 2D image of E. coli irradiated cells; C1 – 2D image of Rec30 control cells; C2 – 2D image of Rec30 irradiated cells; D1 – one optical slice of a series of D. radiopugnans control cells; D2 – one optical slice of a series of D. radiopugnans irradiated cells.