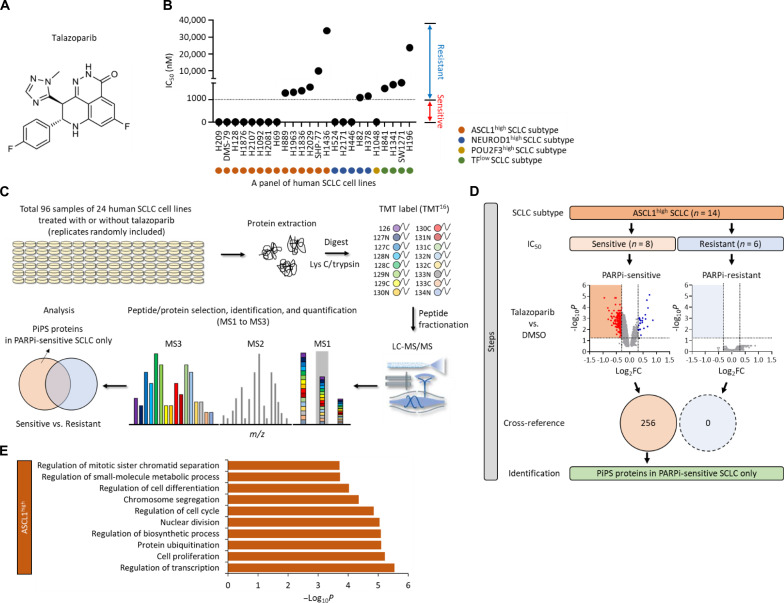
Fig. 1. Identification of a PiPS in SCLC.
(A) Structure of talazoparib. (B) Value of IC50 in a total of 24 SCLC cell lines treated with talazoparib. SCLC cell lines are indicated as ASCL1high, NEUROD1high, POU2F3high, or TFlow subtype. The sensitivity is defined as: sensitive (red), IC50 < 1 μM; resistant (blue), IC50 > 1 μM. TFlow, low expression of all three TFs. (C) Workflow of high-throughput multiplexed quantitative proteome mapping in a total of 96 proteome samples including a total of 24 SCLC lines treated with or without talazoparib (1 μM for 48 hours) in a total of six Tandem Mass Tag (TMT) experiments. (D) Steps of the identification of PARPi-induced protein degradation signature (PiPS) proteins only identified in PARPi-sensitive ASCL1high SCLC subtype. Volcano plots show differentially expressed proteins in talazoparib treatment in each PARPi-sensitive and PARPi-resistant ASCL1high SCLC subtype [log2 fold change (log2FC) < −0.3, P < 0.05]. Venn diagram shows the number of identified PiPS proteins. (E) Gene Ontology (GO) analyses of PiPS proteins identified in PARPi-sensitive ASCL1high SCLC subtype. Biological processes were analyzed using the ToppGene database (https://toppgene.cchmc.org/). LC-MS/MS, liquid chromatography tandem MS; m/z, mass-charge ratio.

