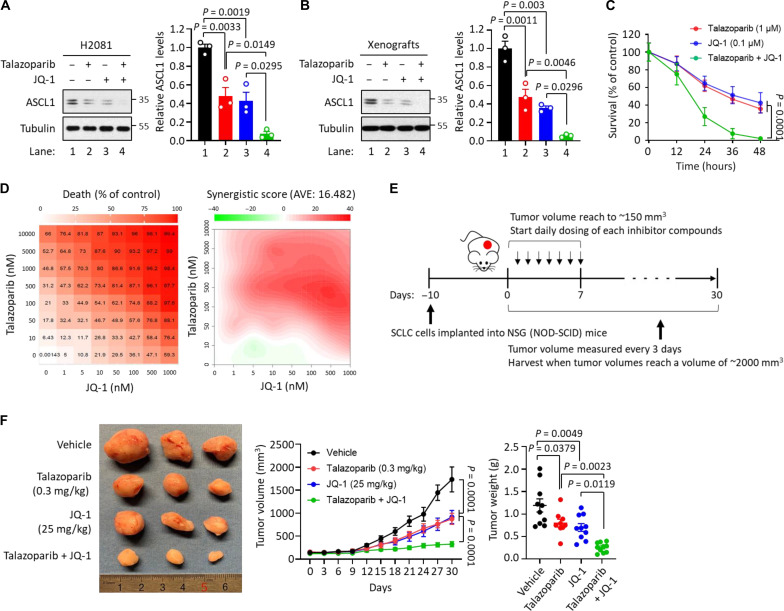
Fig. 4. The synergistic effects between talazoparib and BET inhibitor JQ-1.
(A) Effect of talazoparib with JQ-1 in ASCL1 degradation. H2081 cells were treated with talazoparib (1 μM for 48 hours), JQ-1 (0.1 μM for 48 hours), or talazoparib + JQ-1 as indicated, and the cell lysates were subjected to immunoblot analysis using the indicated antibodies. Values were presented as means ± SD (n = 3). (B) Effect of talazoparib with JQ-1 in ASCL1 degradation in vivo. Mice implanted with H2081 cells were treated with talazoparib (0.3 mg/kg), JQ-1 (25 mg/kg), or talazoparib + JQ-1 as indicated, and the tumor extracts were subjected to immunoblot analysis using the indicated antibodies. Values were presented as means ± SD (n = 3). (C) Effect of talazoparib with JQ-1 in a time-dependent manner. H2081 cells were treated with talazoparib (1 μM), JQ-1 (0.1 μM), or talazoparib + JQ-1 in a time-dependent manner. Viability was measured using a CellTiter-Glo assay, and all values were normalized by the DMSO control (100%) in each time point and presented as means ± SEM (n = 3). (D) Antitumor effect of talazoparib with JQ-1 in a concentration-dependent manner demonstrated synergy. H2081 cells were treated with talazoparib, JQ-1, or talazoparib + JQ-1 in a concentration-dependent manner. Viability was measured using a CellTiter-Glo assay. Left: Cell death ratio; right: synergistic score. AVE, average. (E) Overview of H2081-implanted xenograft tumor models. (F) Synergistic effects of talazoparib with JQ-1 in vivo. Mice implanted with H2081 cells were treated with talazoparib (0.3 mg/kg), JQ-1 (25 mg/kg), or talazoparib + JQ-1 as indicated. Left: The image of representative tumors; right: tumor volume and weight. Values were presented as means ± SD (n = 6 to 10).

